 2
2peptides
spectra
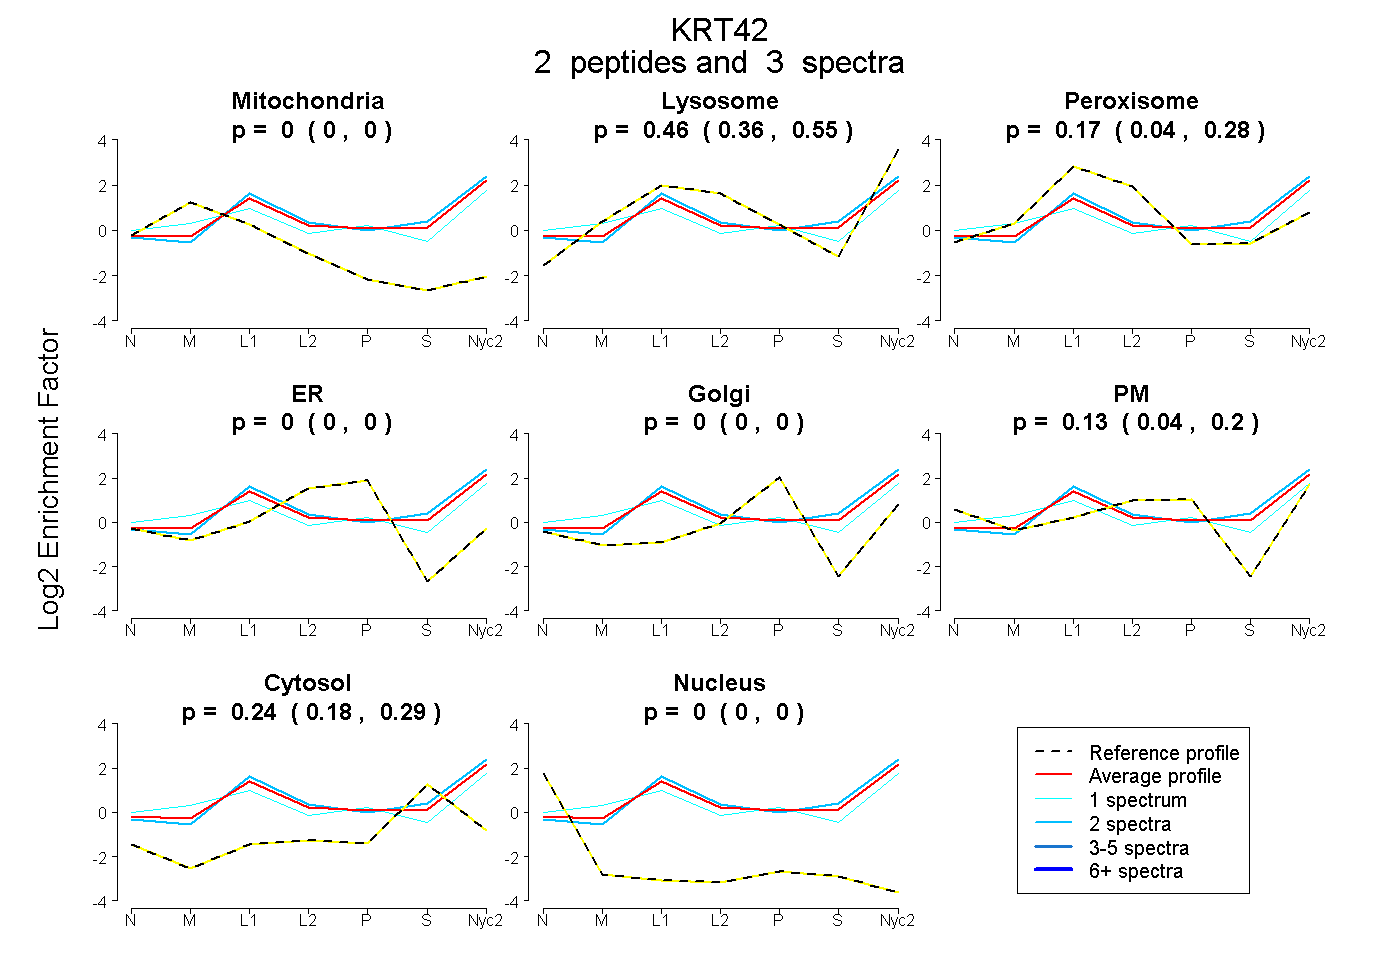
0.000 | 0.000
0.355 | 0.549
0.040 | 0.280
0.000 | 0.000
0.000 | 0.000
0.043 | 0.200
0.184 | 0.291
0.000 | 0.000
3peptides
spectra
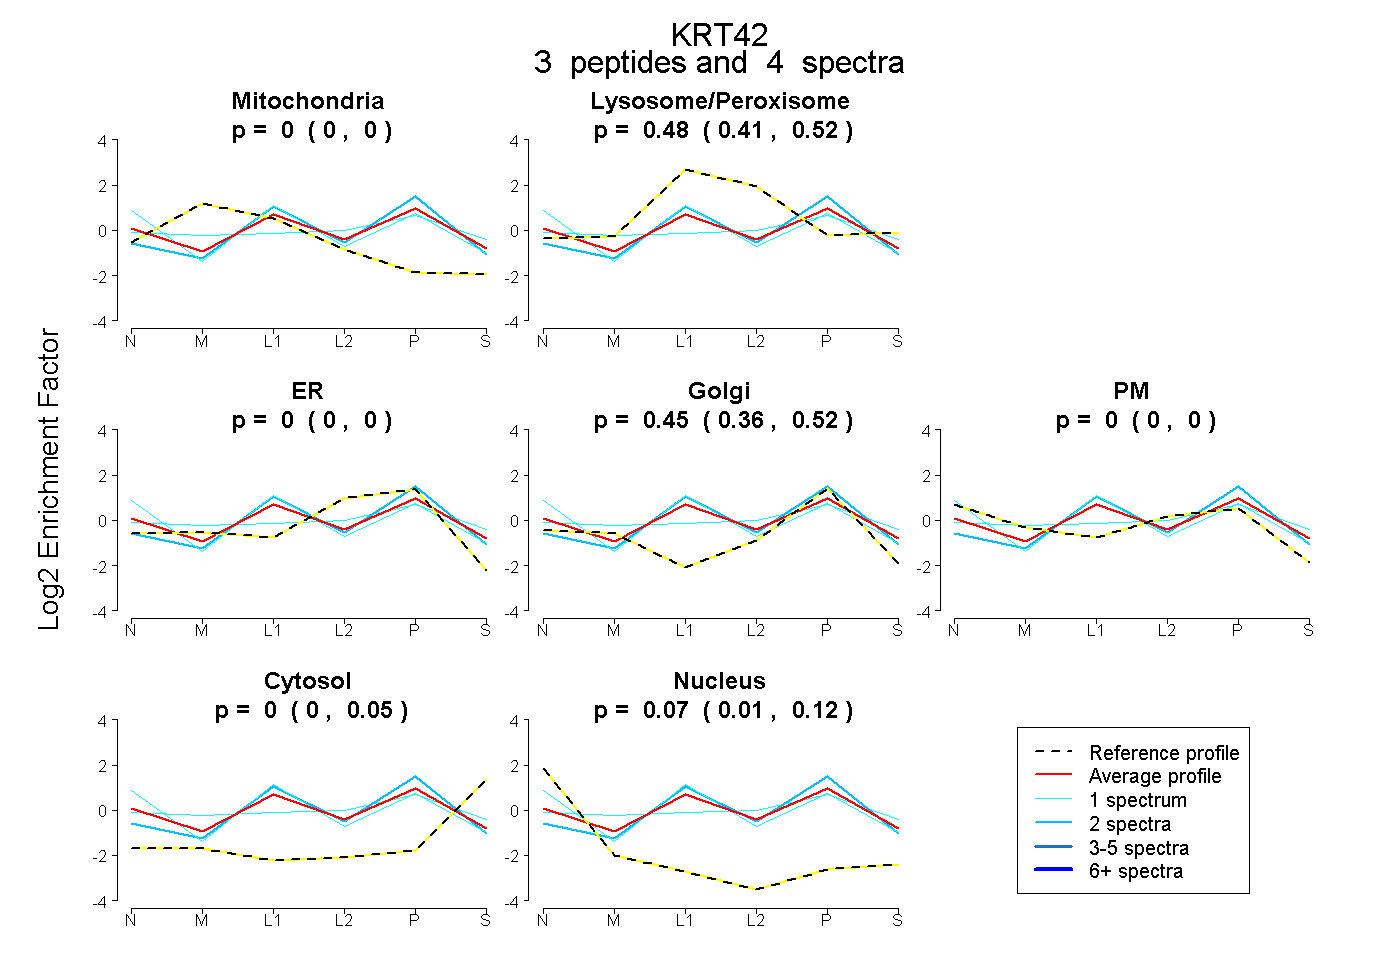
0.000 | 0.000
0.411 | 0.522
0.000 | 0.000
0.357 | 0.523
0.000 | 0.000
0.000 | 0.046
0.008 | 0.117
3peptides
spectra
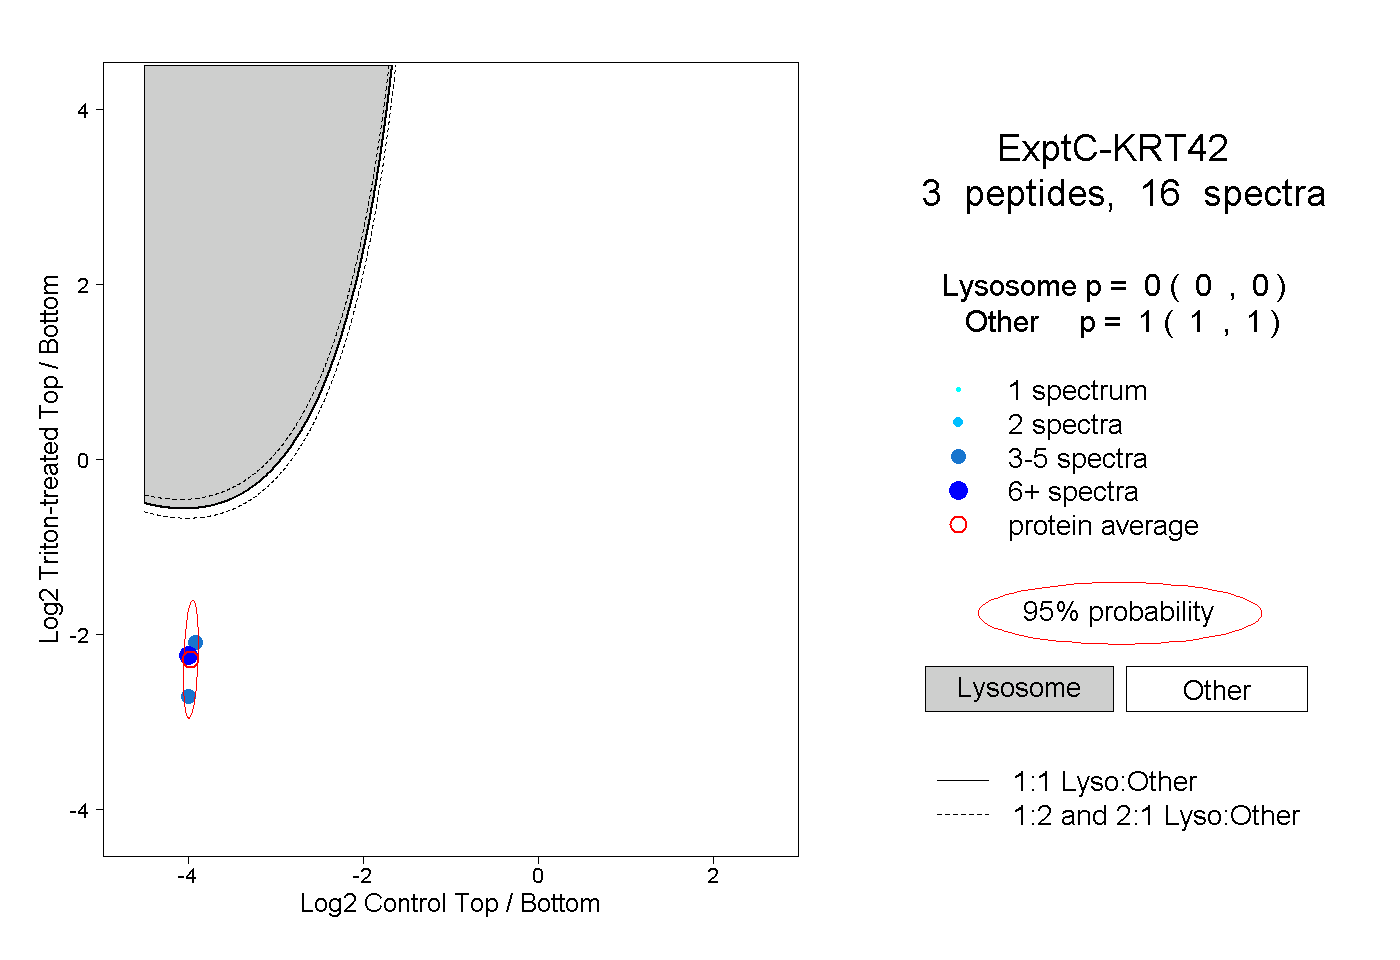
0.000 | 0.000
1.000 | 1.000
1peptide
spectrum
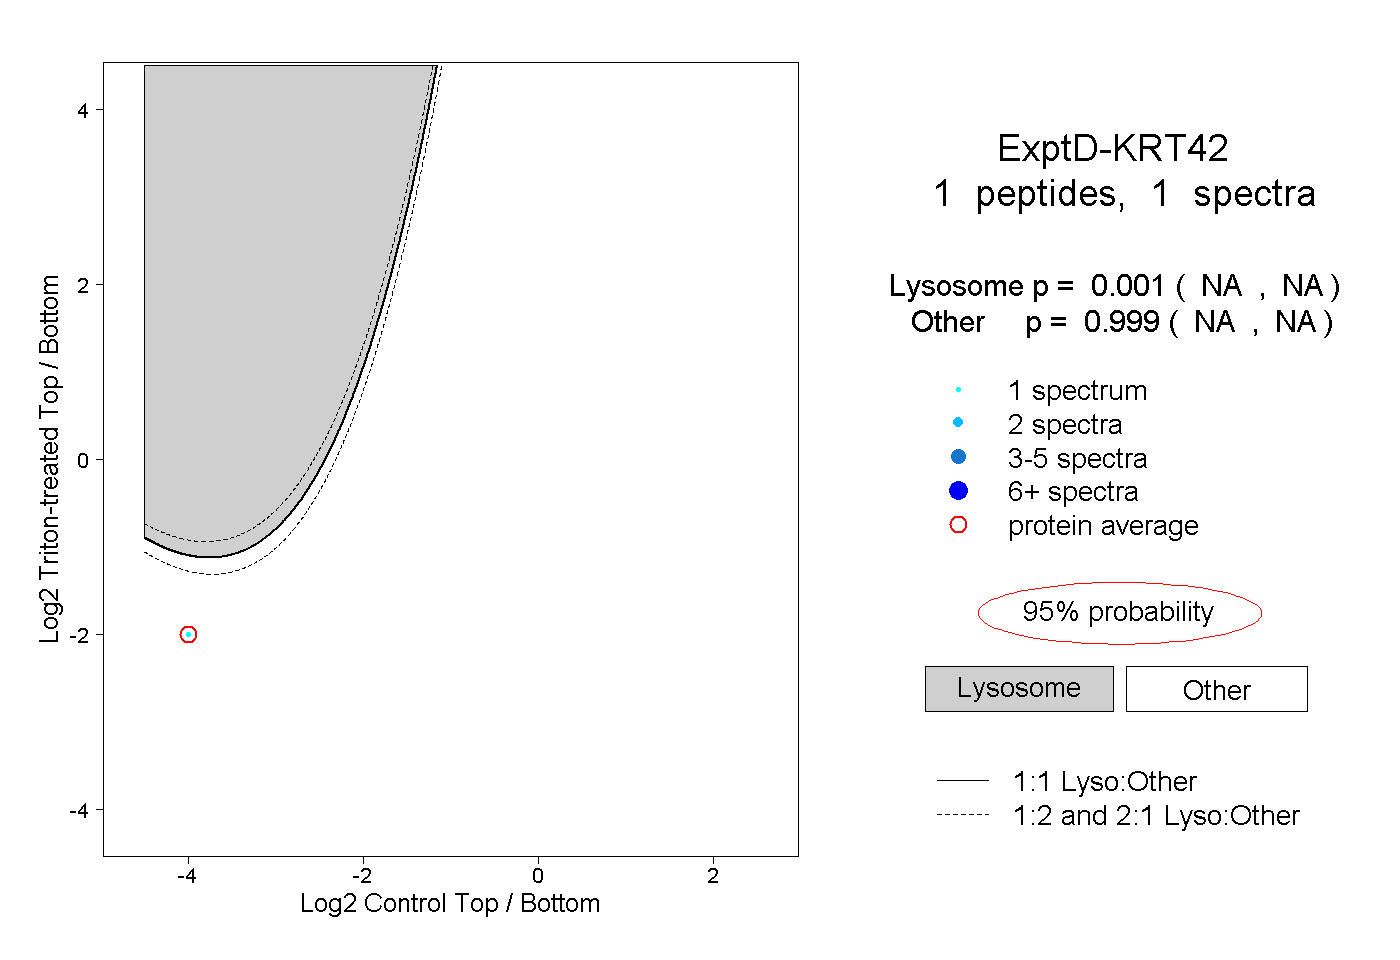
NA | NA
NA | NA