 2
2peptides
spectra
0.000 | 0.000
0.355 | 0.549
0.040 | 0.280
0.000 | 0.000
0.000 | 0.000
0.043 | 0.200
0.184 | 0.291
0.000 | 0.000
| Plot | Mito | Lyso | Perox | ER | Golgi | PM | Cytosol | Nucleus | |||||
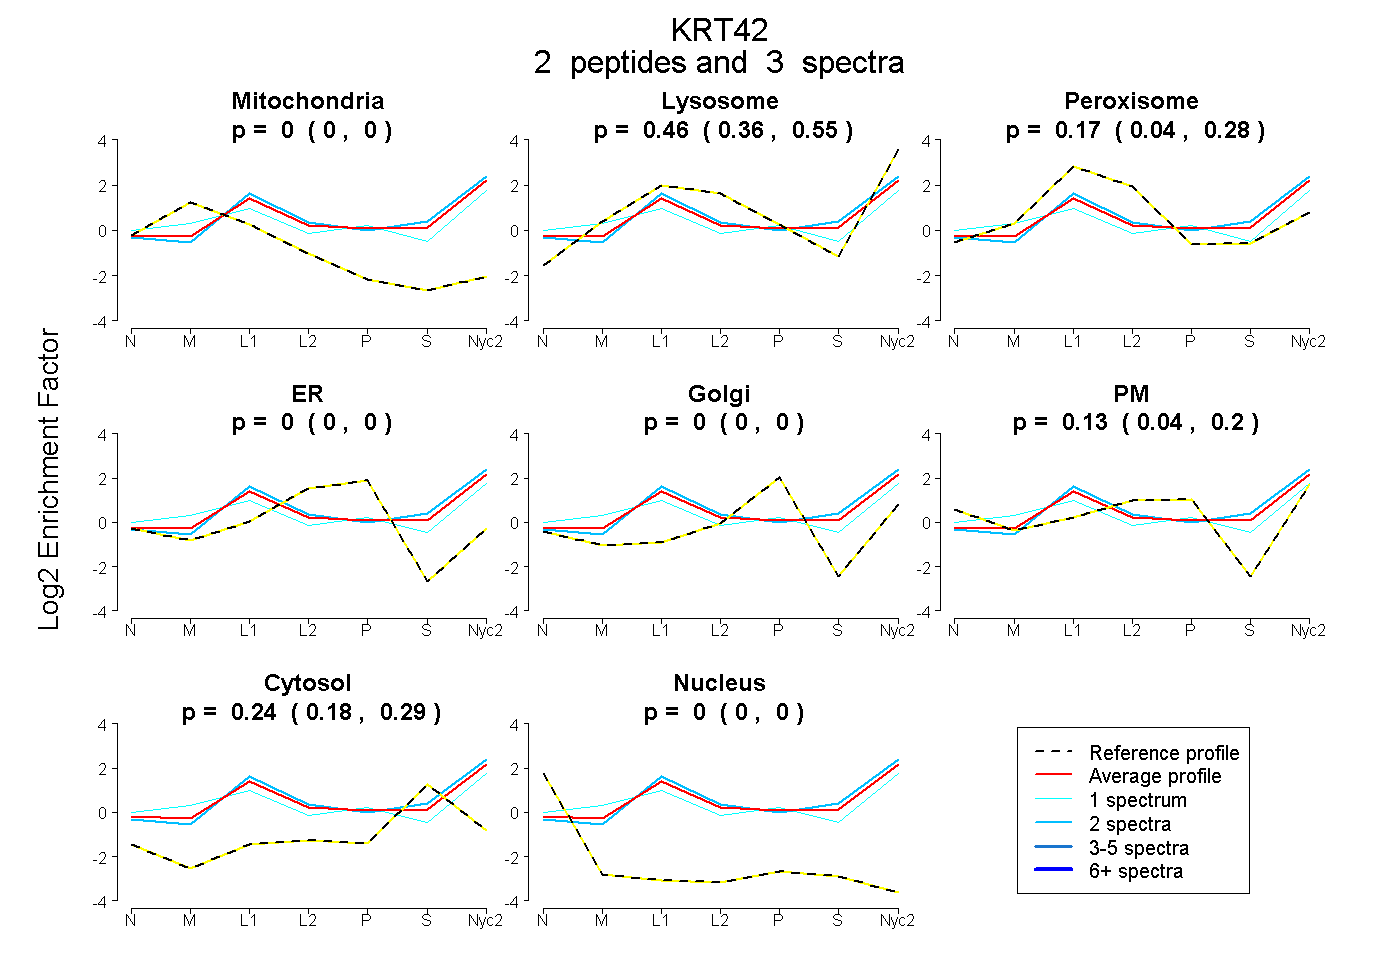
| Expt A |
2 peptides |
3 spectra |
|
0.000 0.000 | 0.000 |
0.457 0.355 | 0.549 |
0.173 0.040 | 0.280 |
0.000 0.000 | 0.000 |
0.000 0.000 | 0.000 |
0.128 0.043 | 0.200 |
0.242 0.184 | 0.291 |
0.000 0.000 | 0.000 |
| 2 spectra, DAEEWFFTK | 0.000 | 0.540 | 0.182 | 0.000 | 0.000 | 0.019 | 0.260 | 0.000 | ||
| 1 spectrum, YETELNLR | 0.089 | 0.366 | 0.074 | 0.000 | 0.000 | 0.289 | 0.182 | 0.000 |
| Plot | Mito | Lyso or Perox | ER | Golgi | PM | Cytosol | Nucleus | ||||||
| Expt B |
3 peptides |
4 spectra |
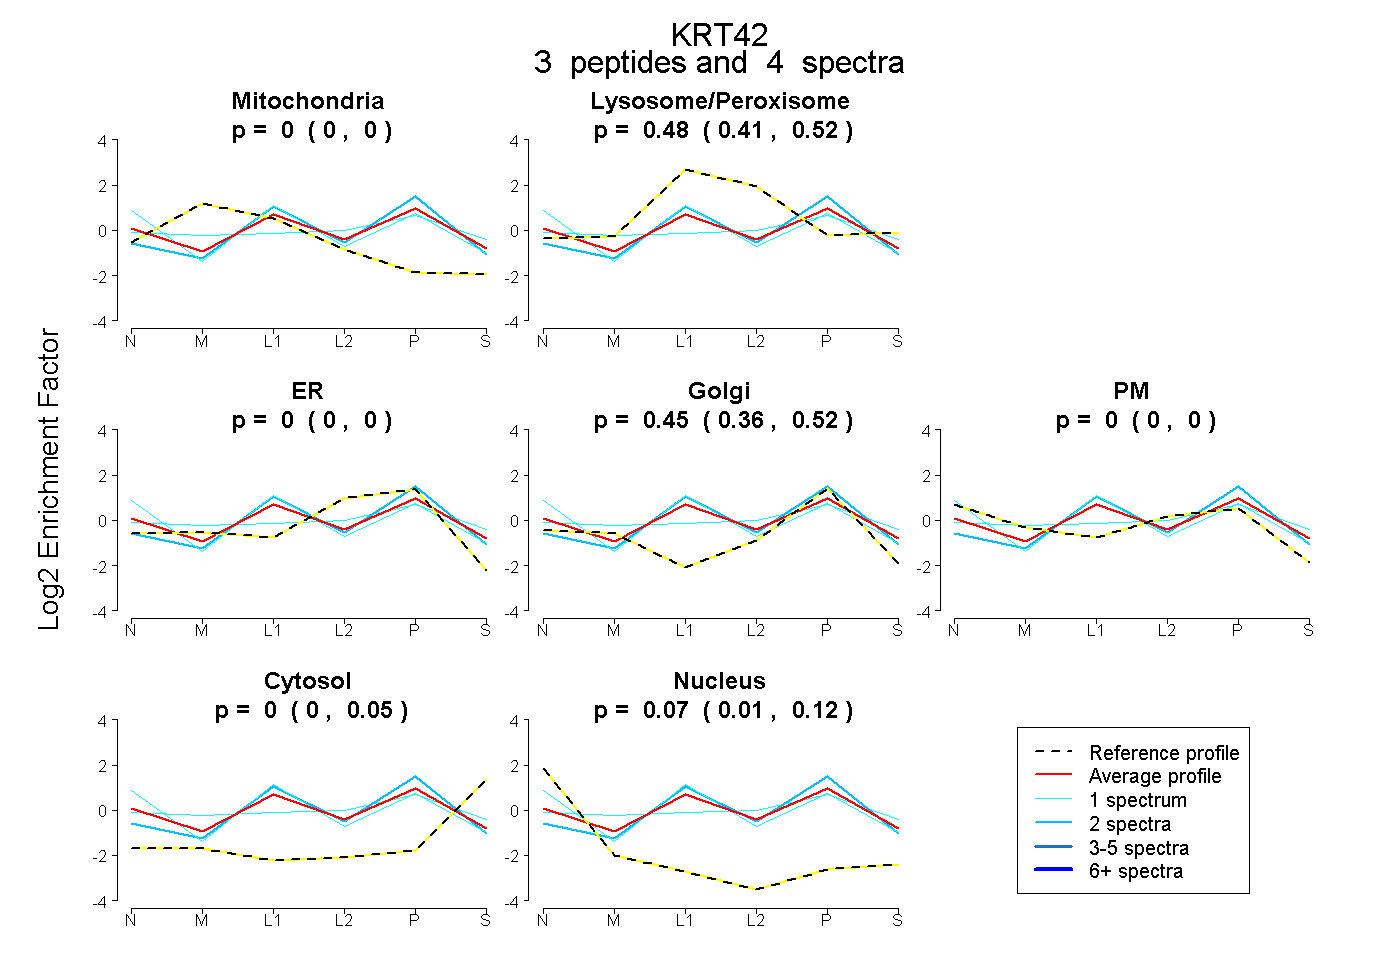 |
0.000 0.000 | 0.000 |
0.476 0.411 | 0.522 |
0.000 0.000 | 0.000 |
0.450 0.357 | 0.523 |
0.000 0.000 | 0.000 |
0.000 0.000 | 0.046 |
0.074 0.008 | 0.117 |
|||
| Plot | Lyso | Other | |||||||||||
| Expt C |
3 peptides |
16 spectra |
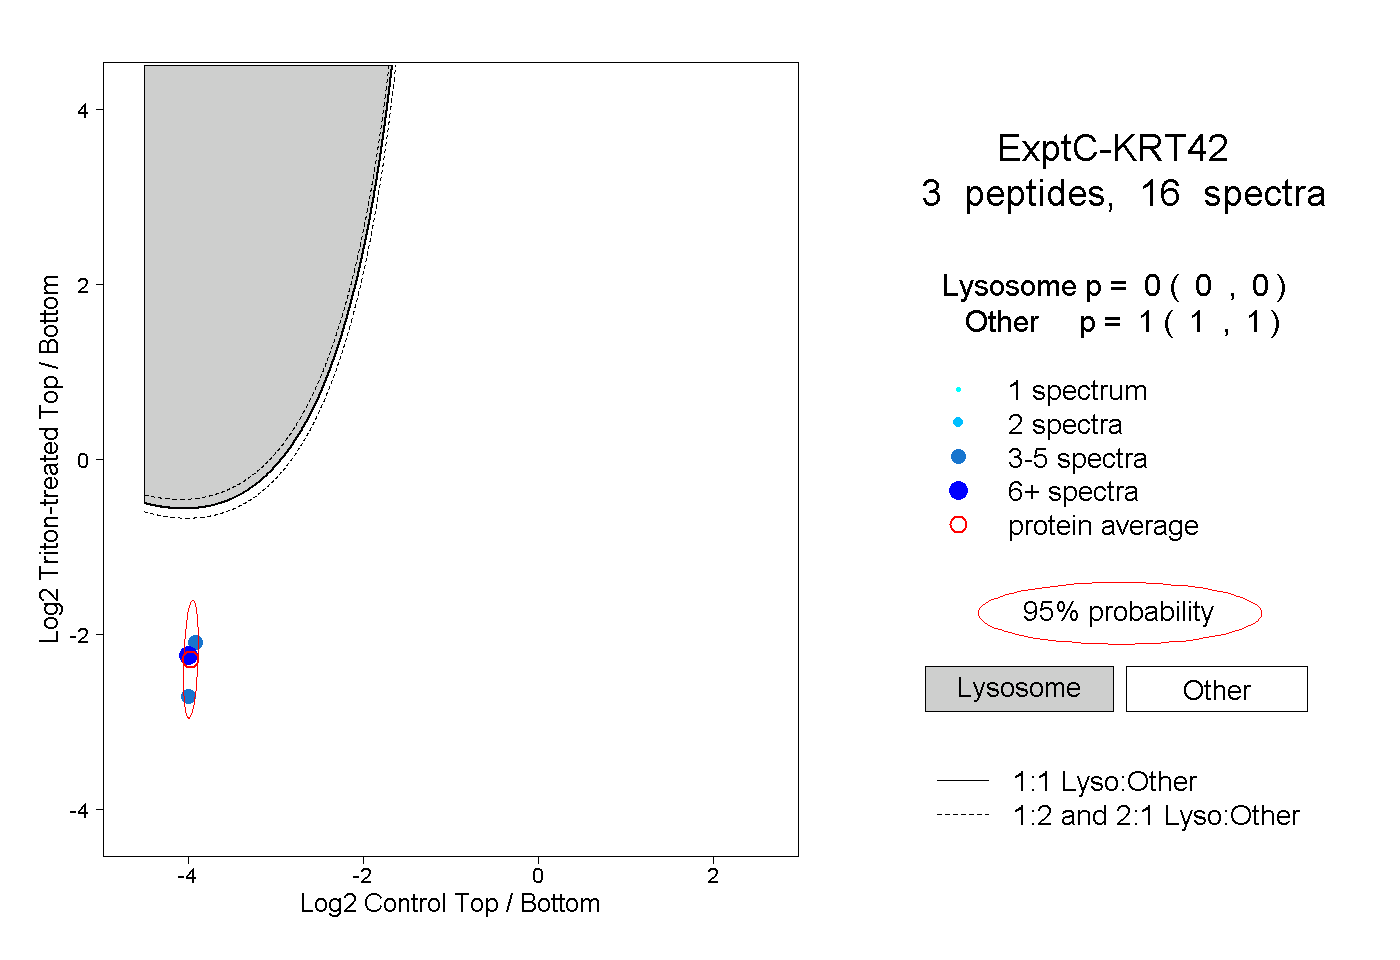 |
0.000 0.000 | 0.000 |
1.000 1.000 | 1.000 |
||||||||
| Plot | Lyso | Other | |||||||||||
| Expt D |
1 peptide |
1 spectrum |
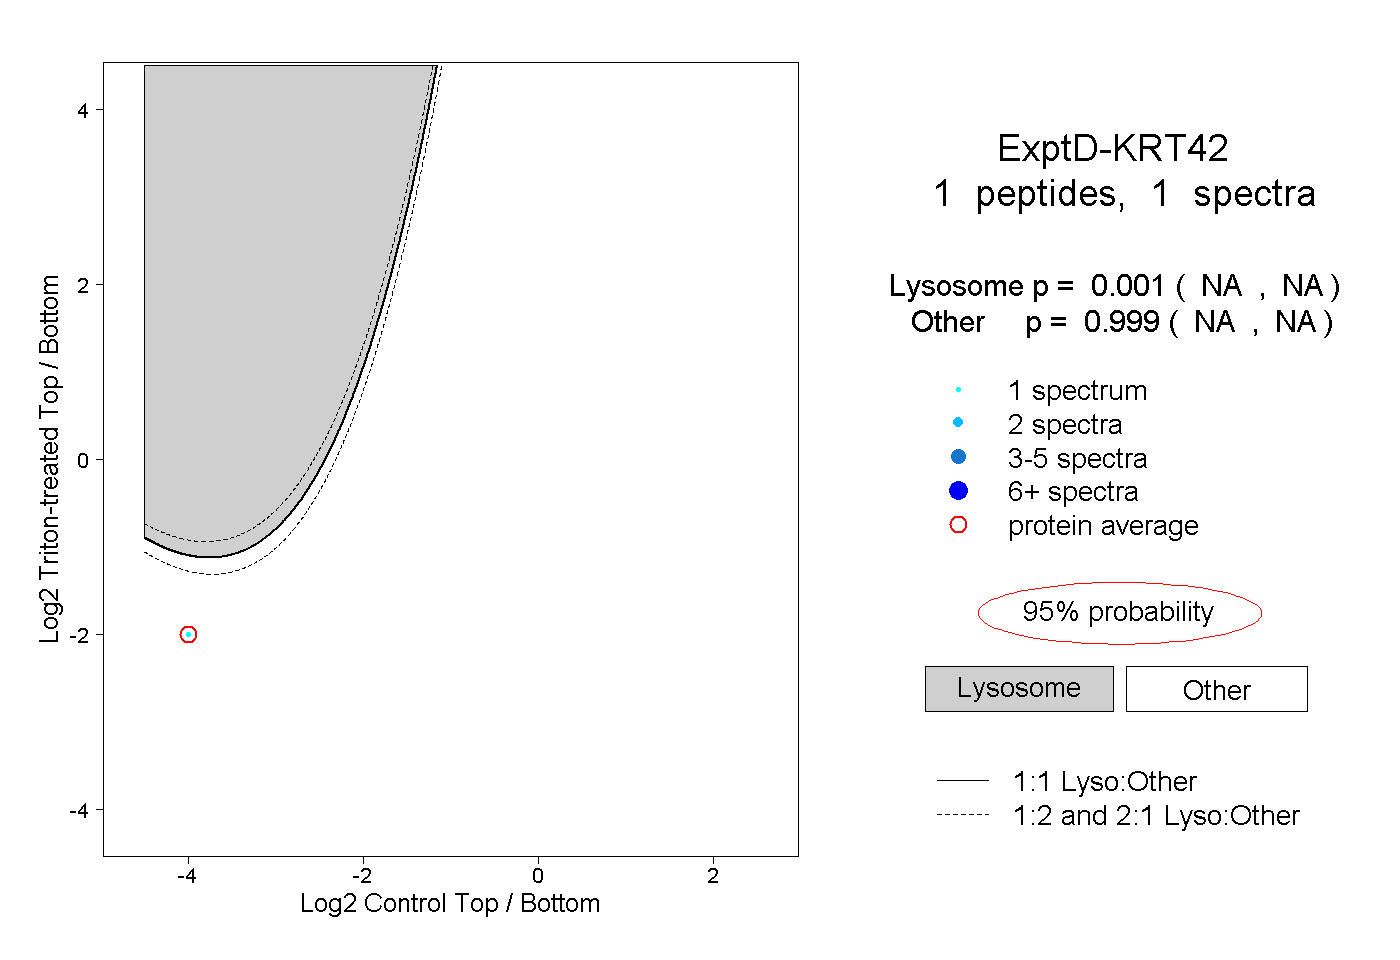 |
0.001 NA | NA |
0.999 NA | NA |