 3
3peptides
spectra
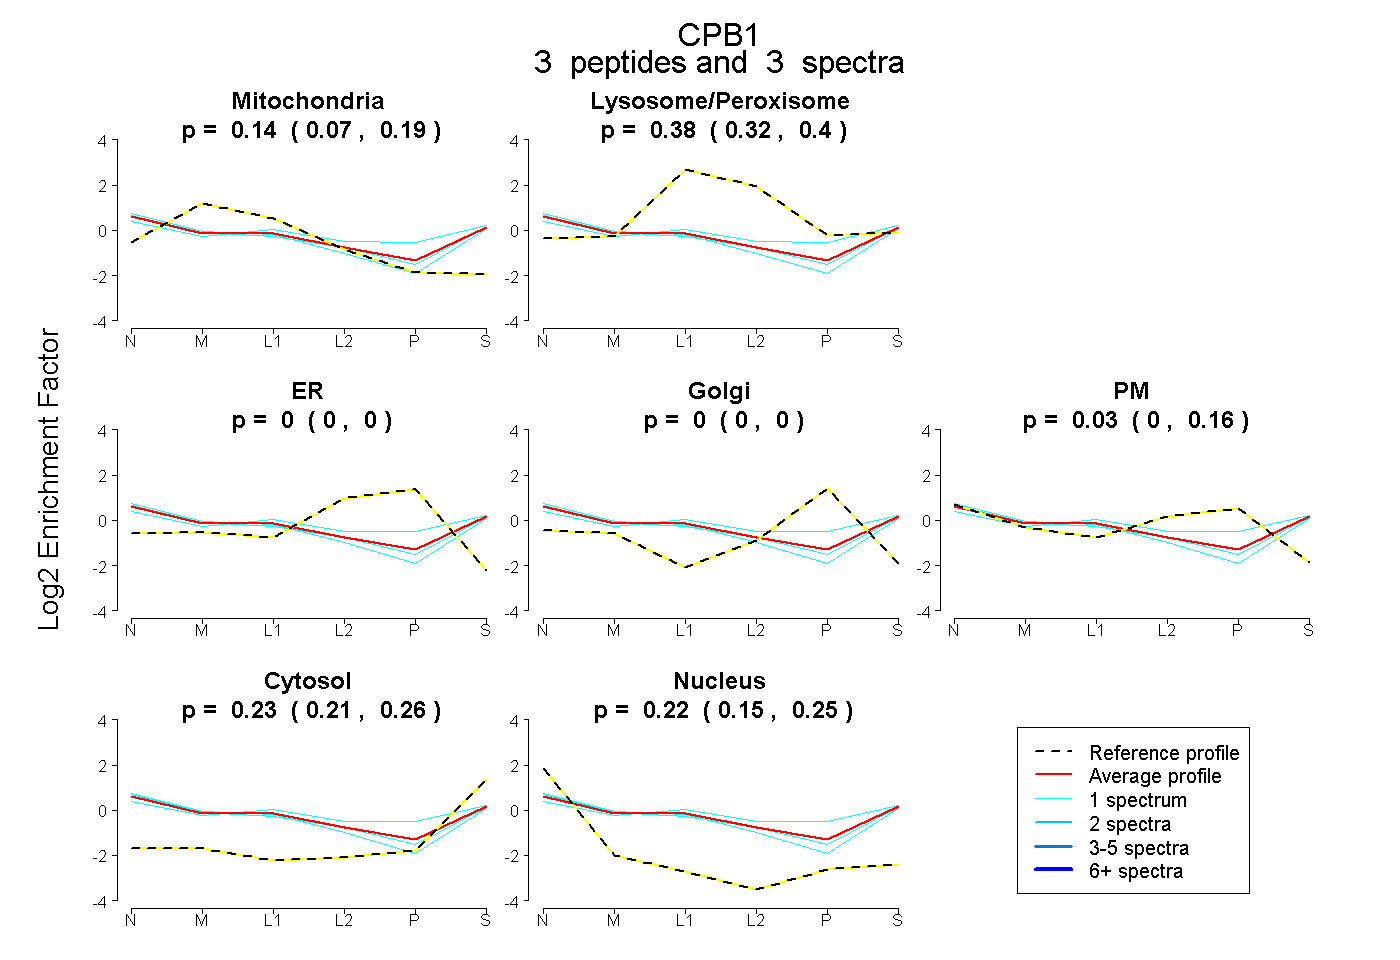
0.073 | 0.187
0.317 | 0.400
0.000 | 0.000
0.000 | 0.000
0.000 | 0.163
0.211 | 0.257
0.149 | 0.250
8peptides
spectra
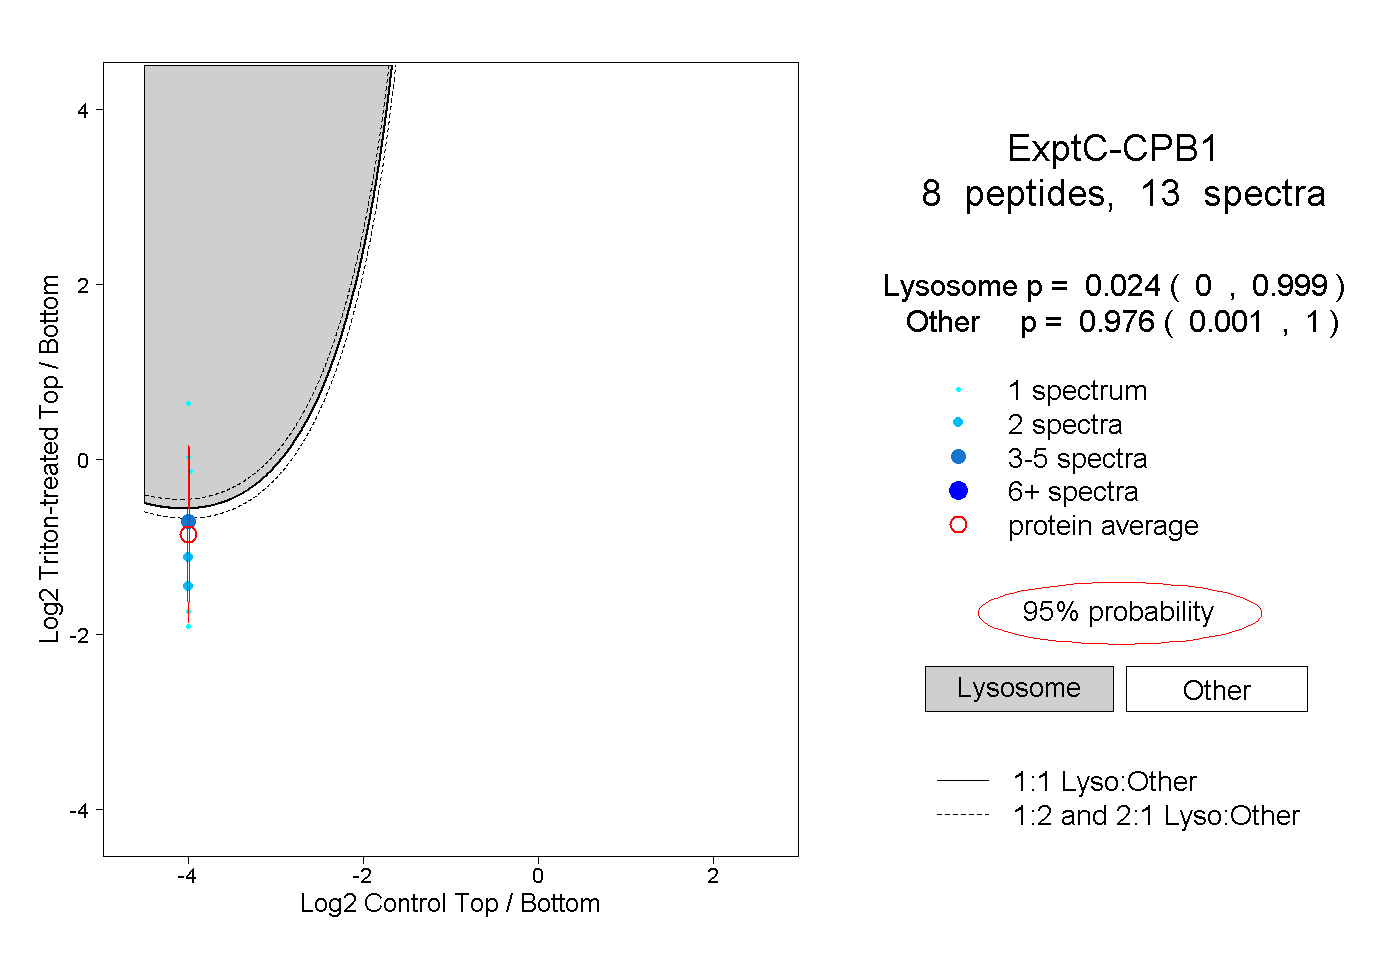
0.000 | 0.999
0.001 | 1.000
1peptide
spectra
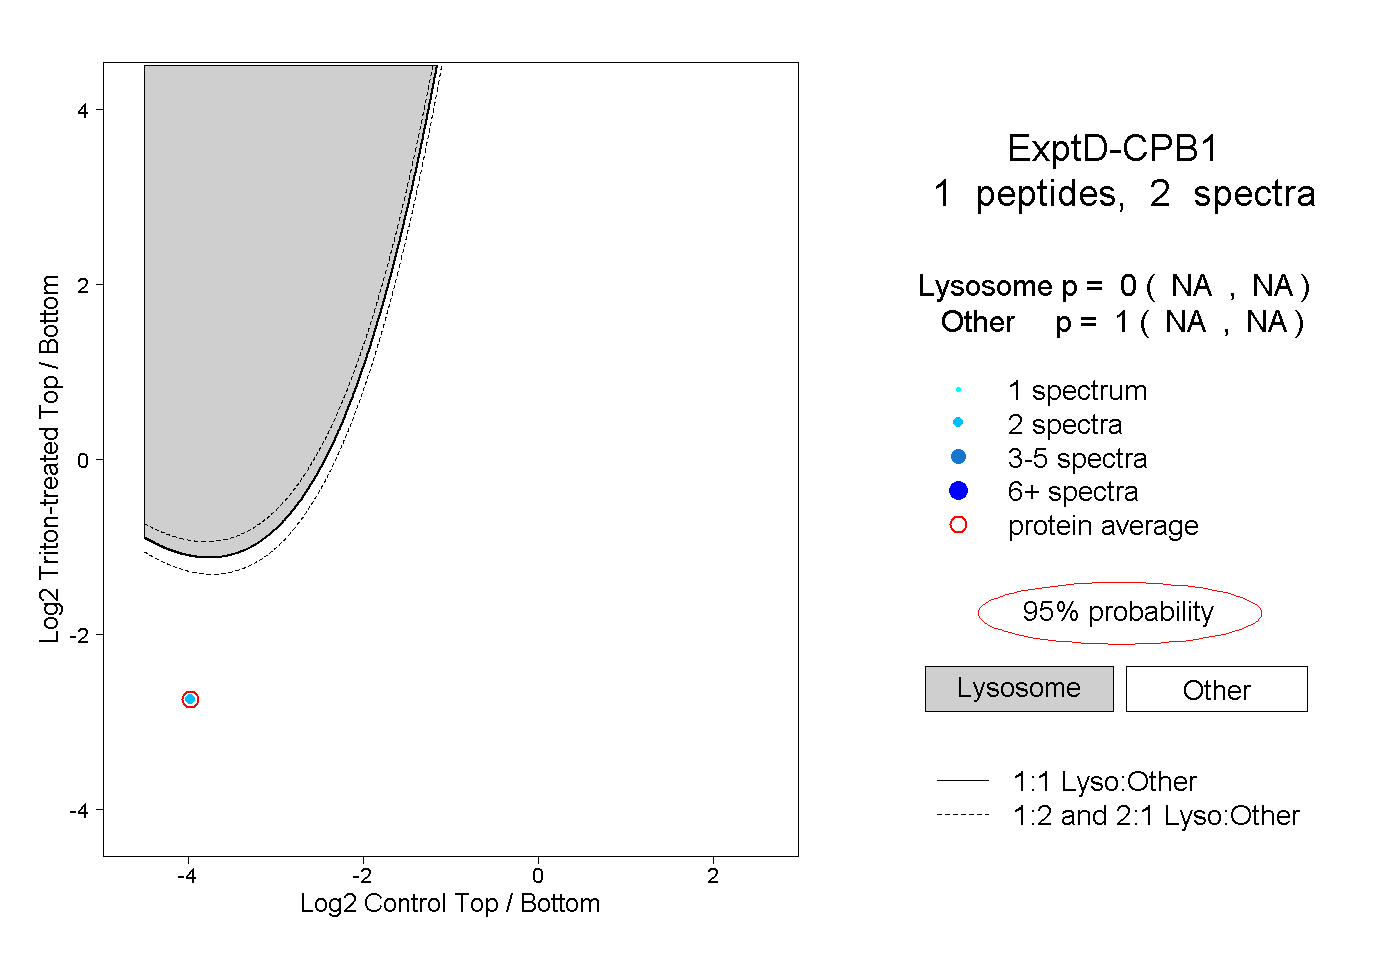
NA | NA
NA | NA