 3
3peptides
spectra
0.073 | 0.187
0.317 | 0.400
0.000 | 0.000
0.000 | 0.000
0.000 | 0.163
0.211 | 0.257
0.149 | 0.250
| Plot | Mito | Lyso or Perox | ER | Golgi | PM | Cytosol | Nucleus | ||||||
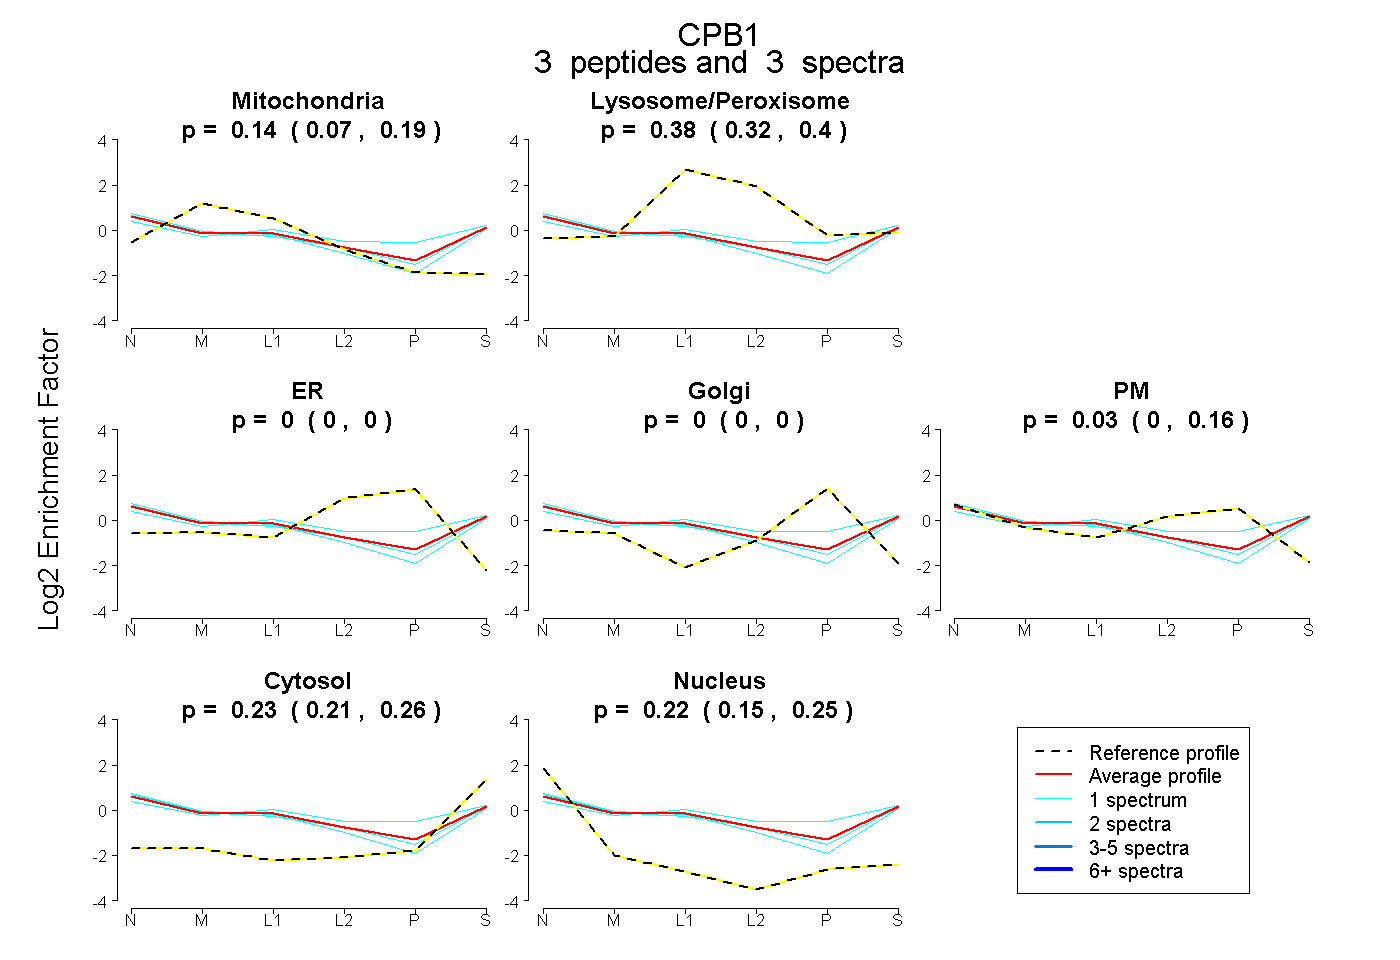
| Expt B |
3 peptides |
3 spectra |
|
0.137 0.073 | 0.187 |
0.375 0.317 | 0.400 |
0.000 0.000 | 0.000 |
0.000 0.000 | 0.000 |
0.033 0.000 | 0.163 |
0.234 0.211 | 0.257 |
0.220 0.149 | 0.250 |
| 1 spectrum, NALESQFDSHTR | 0.021 | 0.370 | 0.000 | 0.000 | 0.249 | 0.269 | 0.091 | |||
| 1 spectrum, ALADFIR | 0.221 | 0.307 | 0.000 | 0.000 | 0.000 | 0.216 | 0.256 | |||
| 1 spectrum, YIANYVR | 0.159 | 0.362 | 0.000 | 0.000 | 0.006 | 0.229 | 0.245 |
| Plot | Lyso | Other | |||||||||||
| Expt C |
8 peptides |
13 spectra |
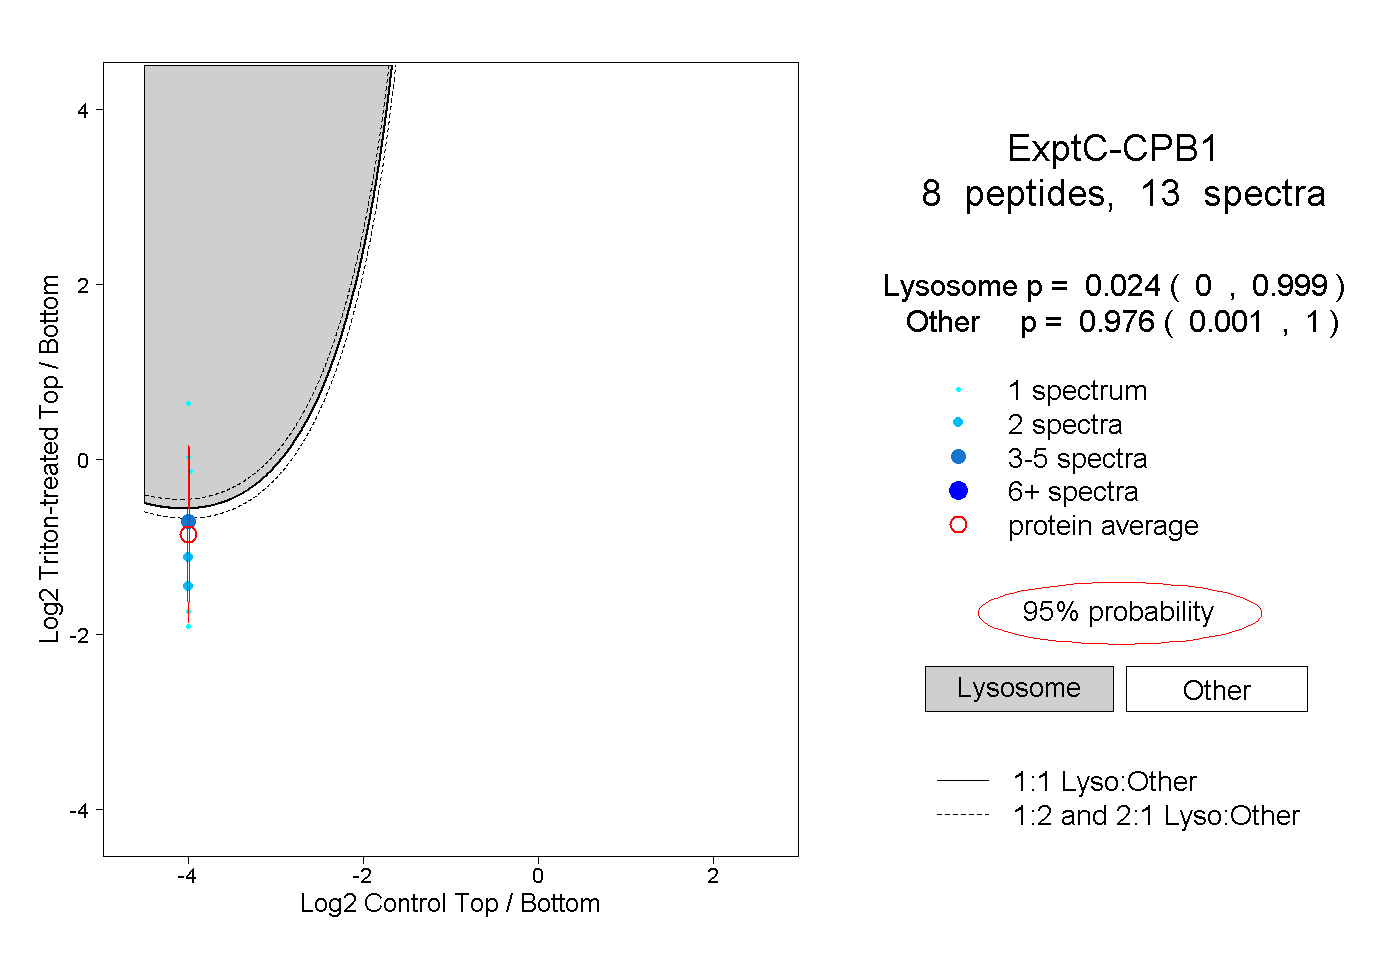 |
0.024 0.000 | 0.999 |
0.976 0.001 | 1.000 |
||||||||
| Plot | Lyso | Other | |||||||||||
| Expt D |
1 peptide |
2 spectra |
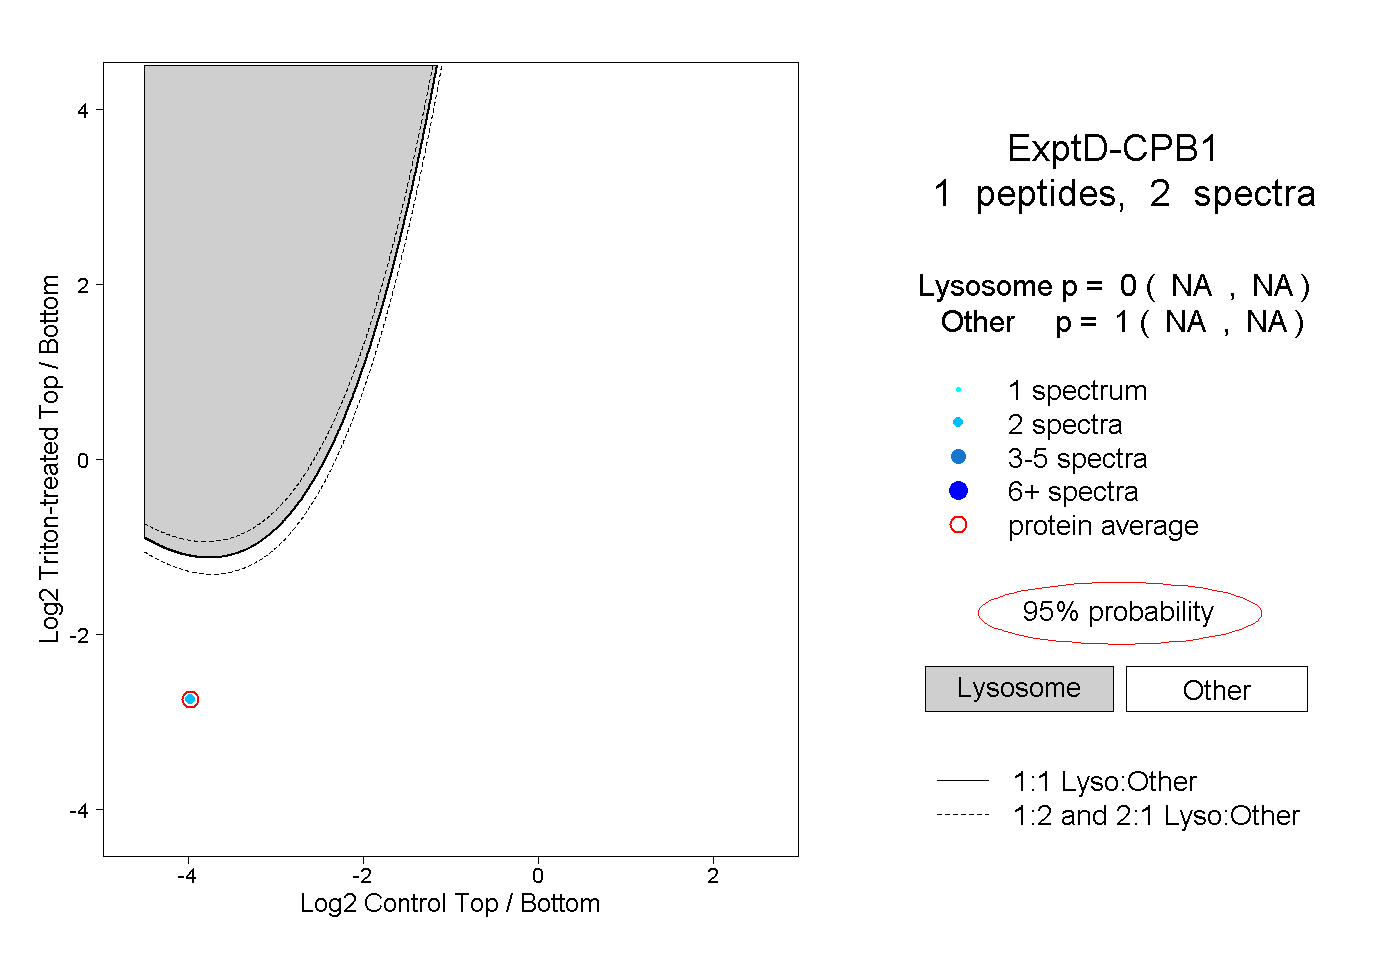 |
0.000 NA | NA |
1.000 NA | NA |