 3
3peptides
spectra
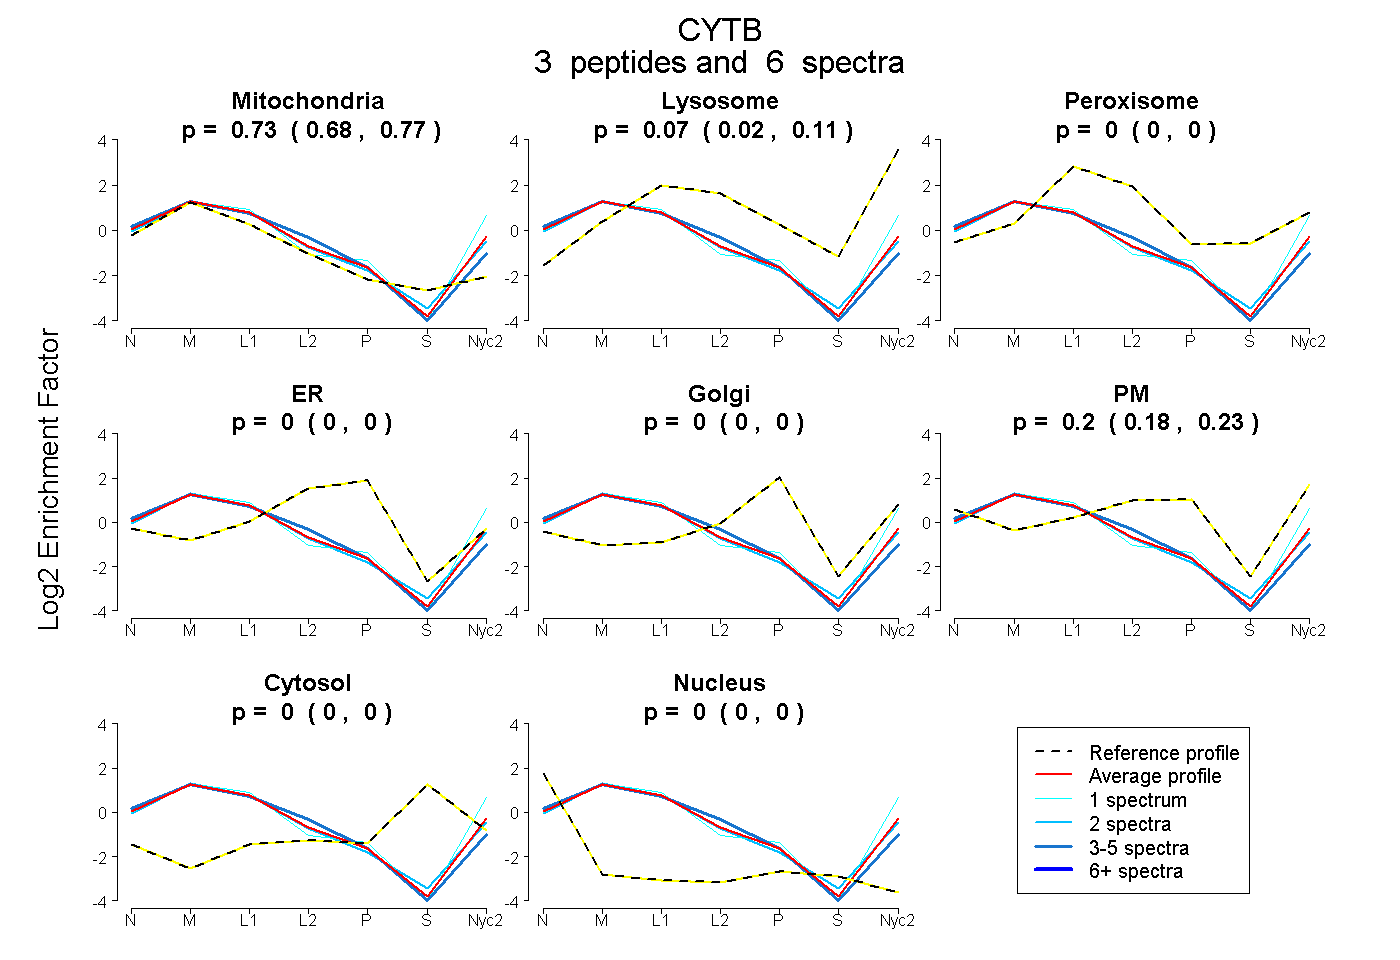
0.684 | 0.766
0.022 | 0.107
0.000 | 0.000
0.000 | 0.000
0.000 | 0.000
0.178 | 0.226
0.000 | 0.000
0.000 | 0.000
2peptides
spectra

0.896 | 0.950
0.000 | 0.000
0.043 | 0.097
0.000 | 0.000
0.000 | 0.000
0.000 | 0.000
0.000 | 0.004
3peptides
spectra
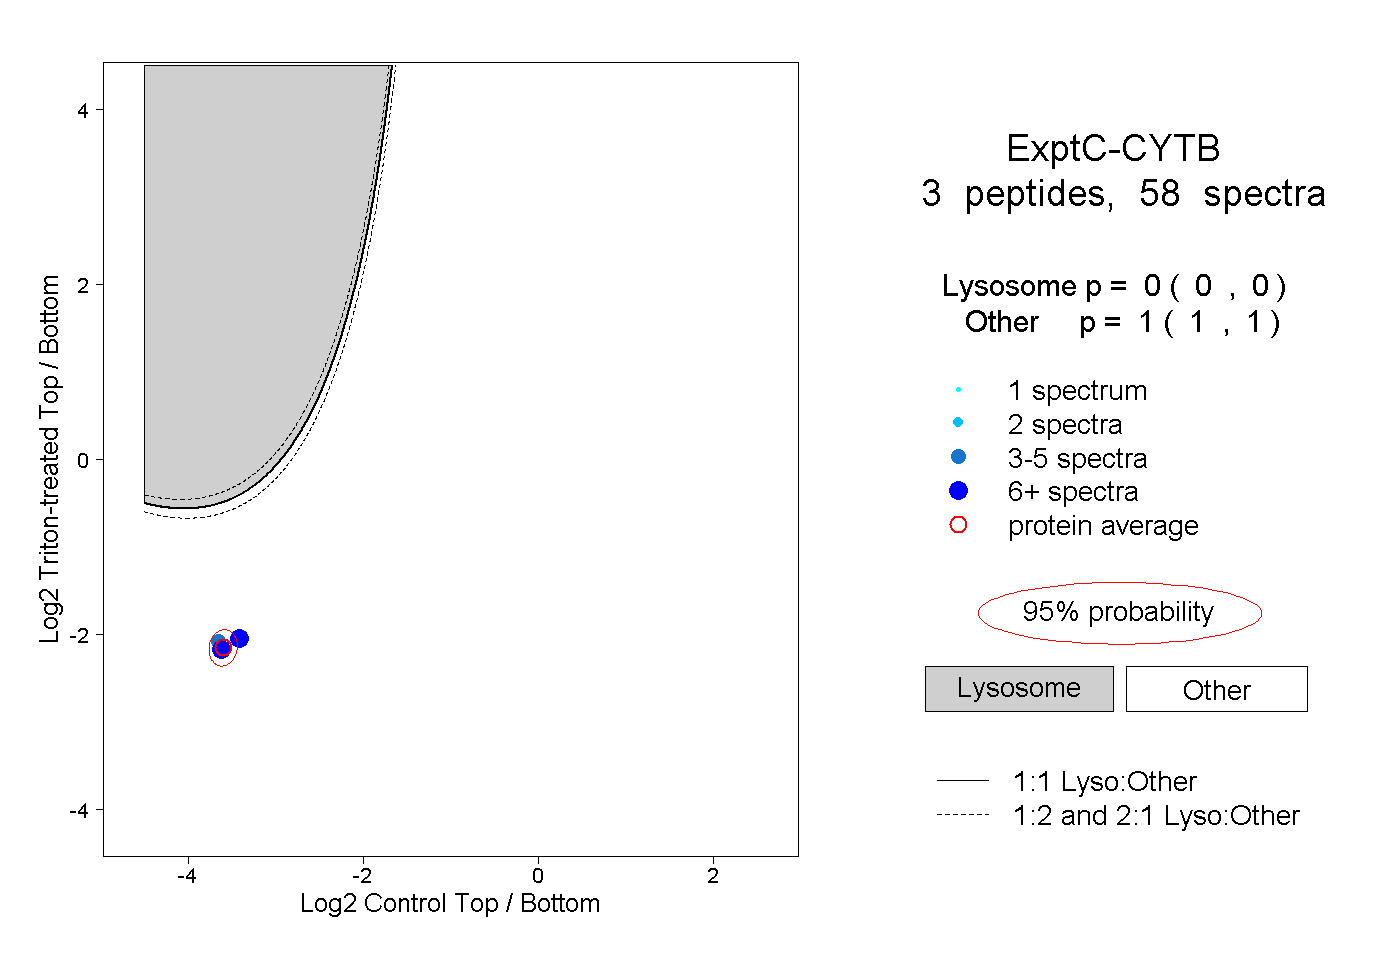
0.000 | 0.000
1.000 | 1.000
2peptides
spectra
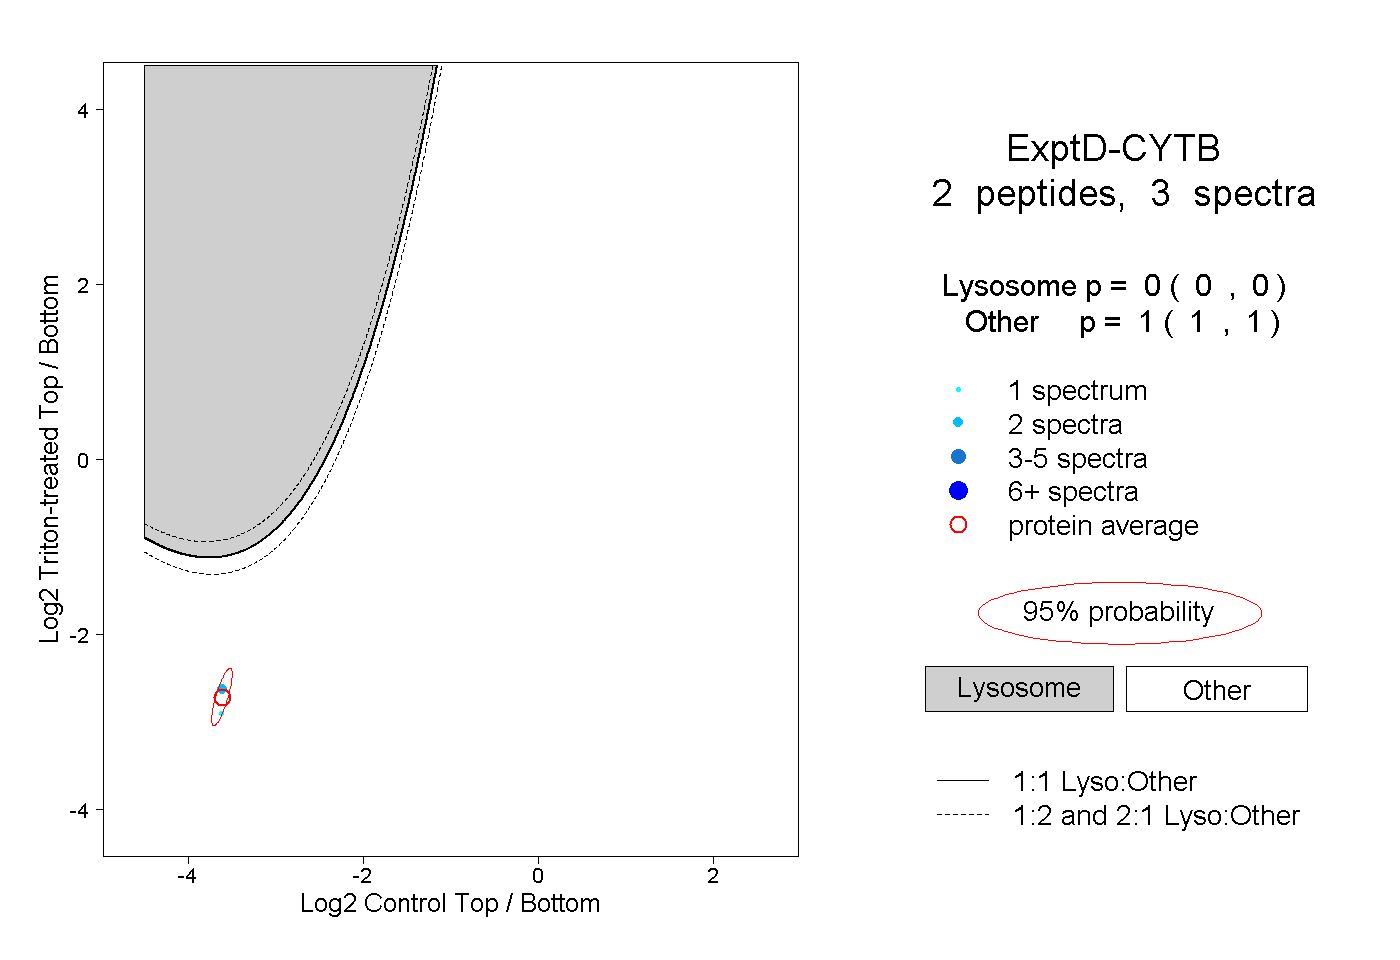
0.000 | 0.000
1.000 | 1.000