 3
3peptides
spectra
0.684 | 0.766
0.022 | 0.107
0.000 | 0.000
0.000 | 0.000
0.000 | 0.000
0.178 | 0.226
0.000 | 0.000
0.000 | 0.000
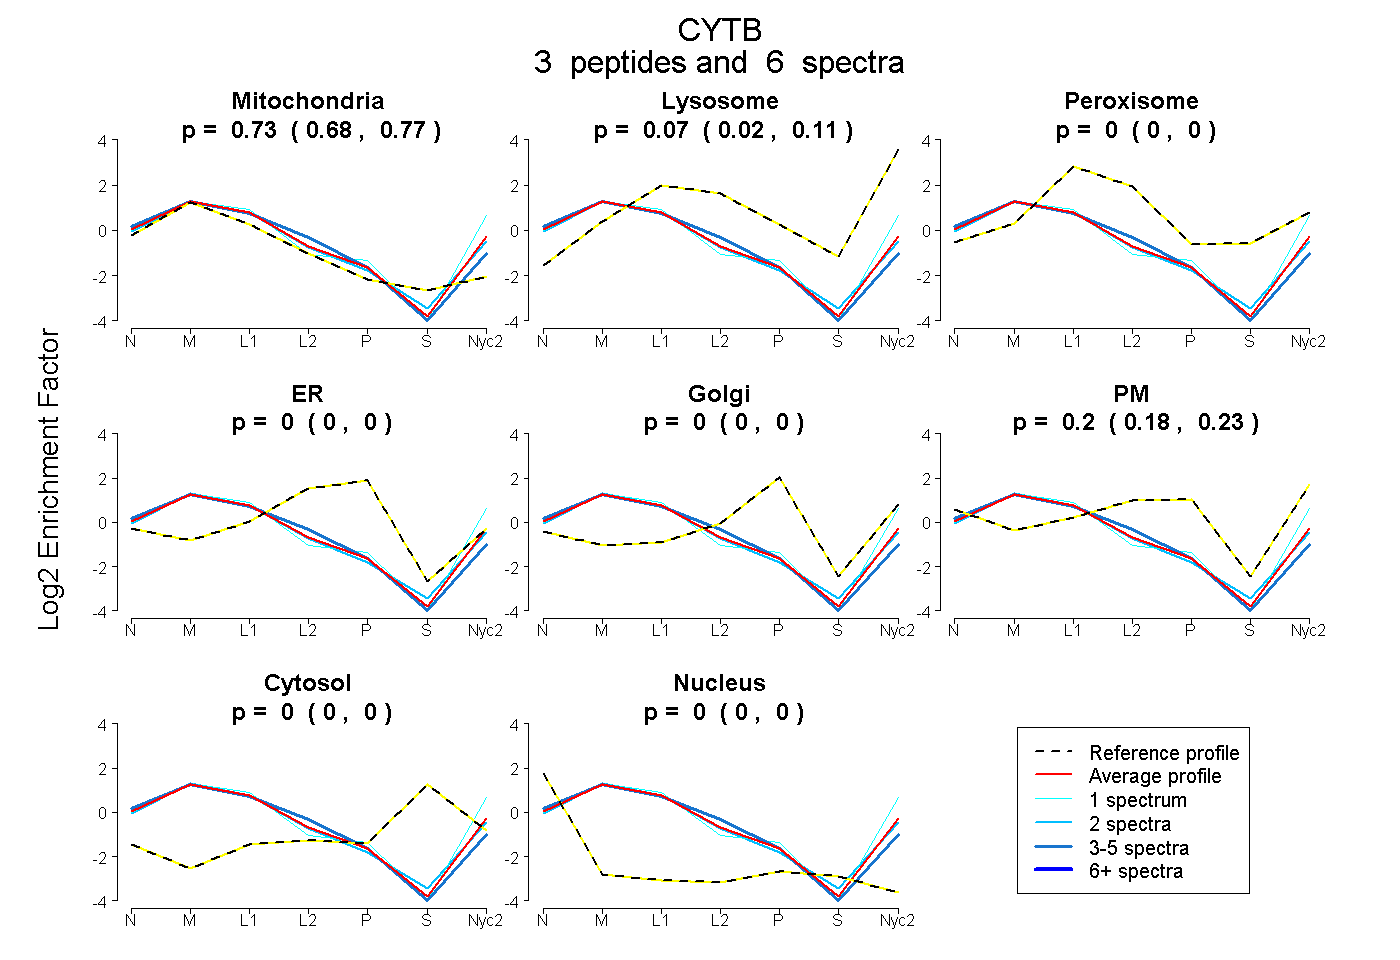
| Plot | Mito | Lyso | Perox | ER | Golgi | PM | Cytosol | Nucleus | |||||
| Expt A |
3 peptides |
6 spectra |
|
0.727 0.684 | 0.766 |
0.070 0.022 | 0.107 |
0.000 0.000 | 0.000 |
0.000 0.000 | 0.000 |
0.000 0.000 | 0.000 |
0.203 0.178 | 0.226 |
0.000 0.000 | 0.000 |
0.000 0.000 | 0.000 |
| 2 spectra, DVNYGWLIR | 0.772 | 0.109 | 0.000 | 0.000 | 0.000 | 0.120 | 0.000 | 0.000 | ||
| 1 spectrum, IPFHPYYTIK | 0.619 | 0.145 | 0.000 | 0.000 | 0.000 | 0.236 | 0.000 | 0.000 | ||
| 3 spectra, SHPLFK | 0.779 | 0.000 | 0.000 | 0.000 | 0.000 | 0.221 | 0.000 | 0.000 |
| Plot | Mito | Lyso or Perox | ER | Golgi | PM | Cytosol | Nucleus | ||||||
| Expt B |
2 peptides |
7 spectra |
 |
0.926 0.896 | 0.950 |
0.000 0.000 | 0.000 |
0.074 0.043 | 0.097 |
0.000 0.000 | 0.000 |
0.000 0.000 | 0.000 |
0.000 0.000 | 0.000 |
0.000 0.000 | 0.004 |
|||
| Plot | Lyso | Other | |||||||||||
| Expt C |
3 peptides |
58 spectra |
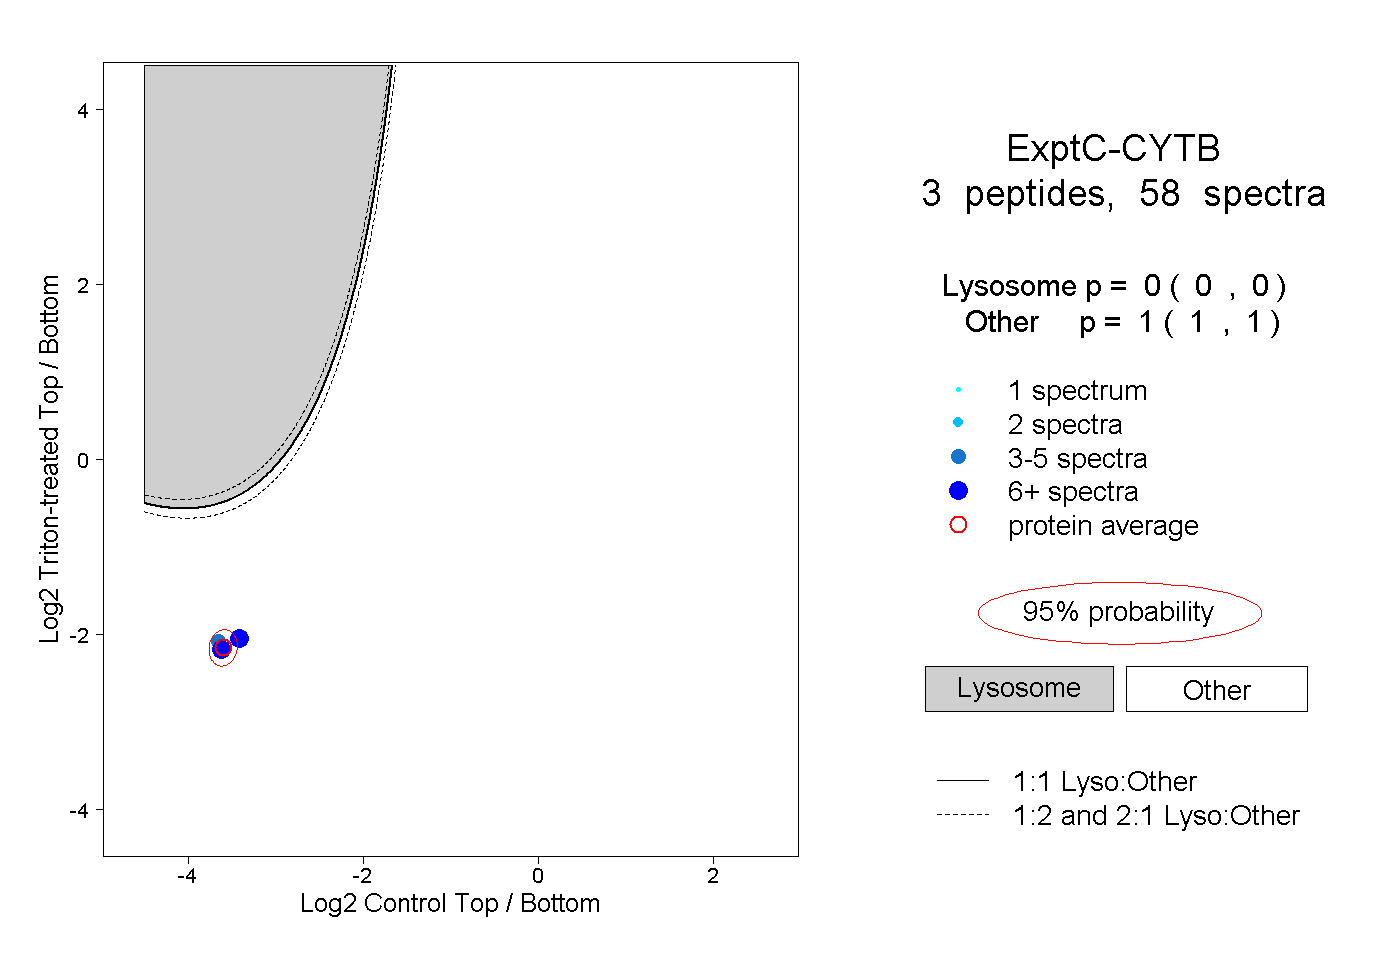 |
0.000 0.000 | 0.000 |
1.000 1.000 | 1.000 |
||||||||
| Plot | Lyso | Other | |||||||||||
| Expt D |
2 peptides |
3 spectra |
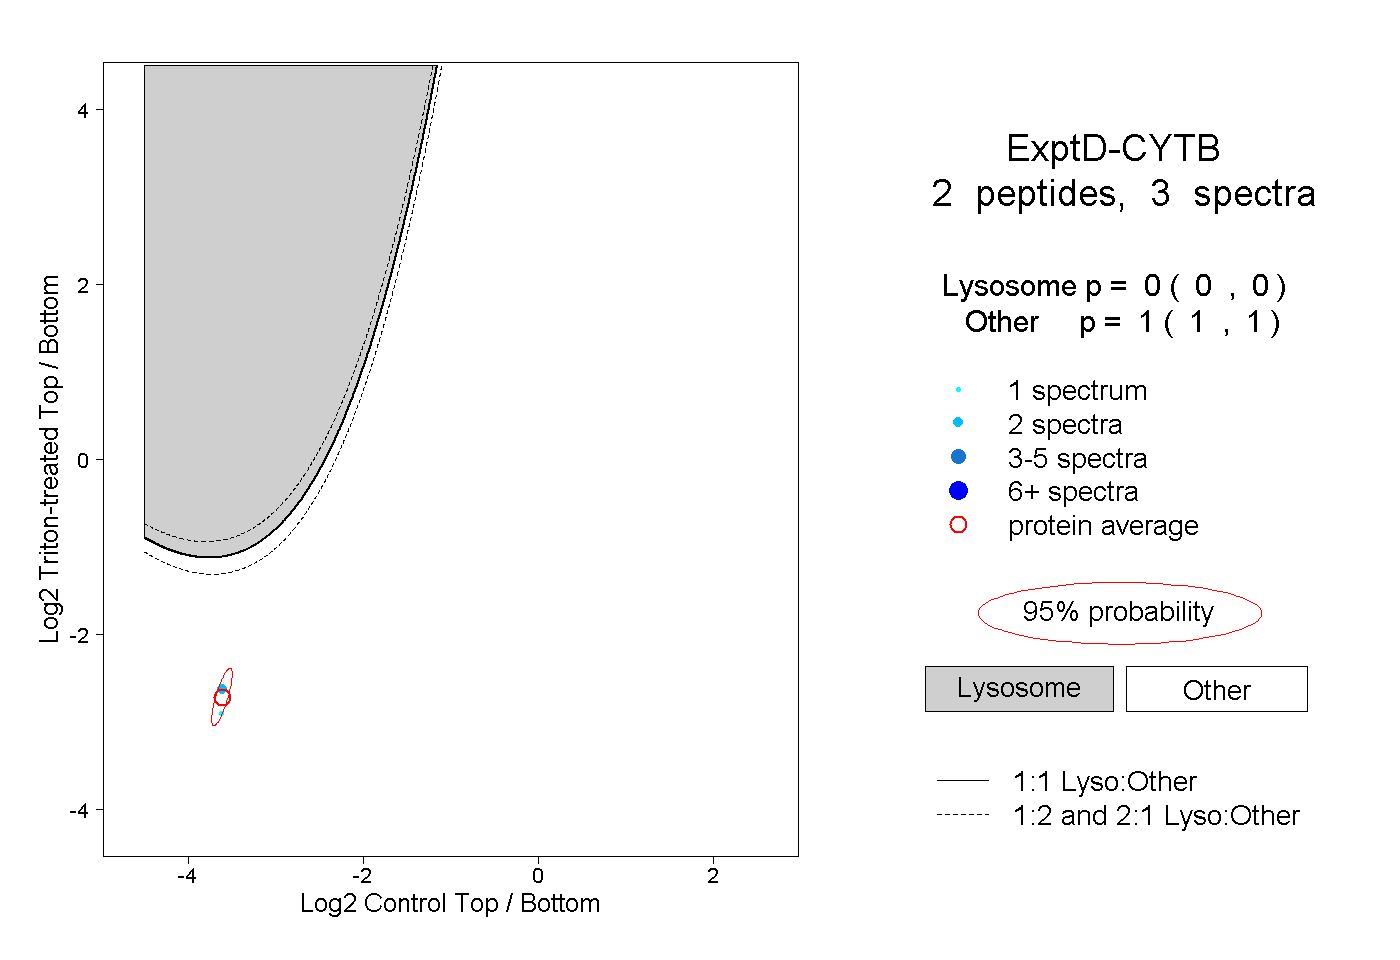 |
0.000 0.000 | 0.000 |
1.000 1.000 | 1.000 |