 10
10peptides
spectra
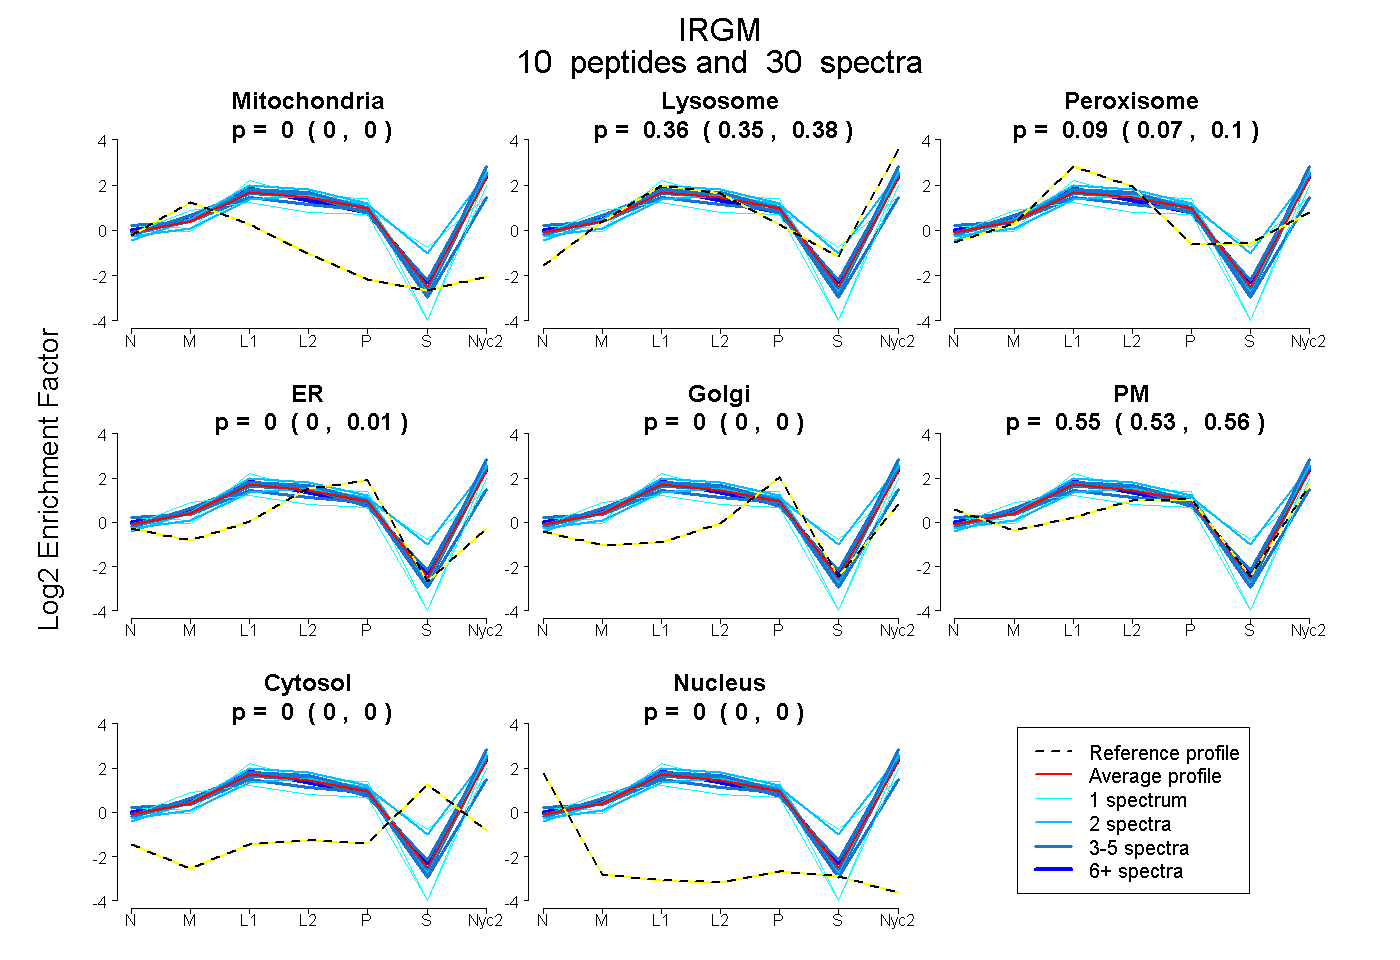
0.000 | 0.000
0.351 | 0.378
0.070 | 0.097
0.000 | 0.014
0.000 | 0.000
0.531 | 0.556
0.000 | 0.000
0.000 | 0.000
5peptides
spectra
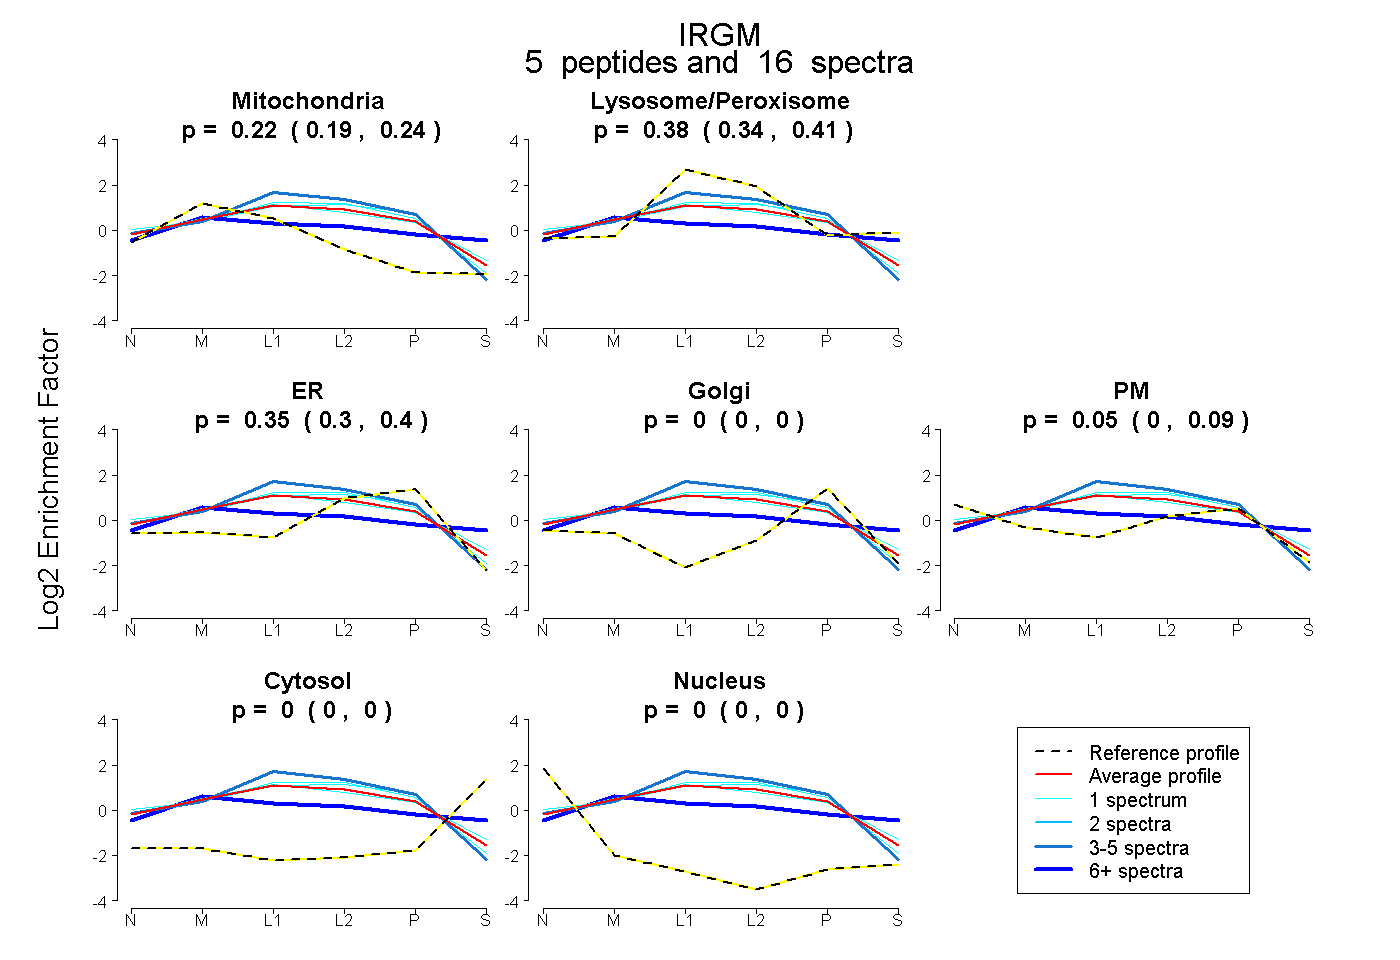
0.186 | 0.239
0.344 | 0.408
0.301 | 0.398
0.000 | 0.000
0.003 | 0.092
0.000 | 0.000
0.000 | 0.000
14peptides
spectra
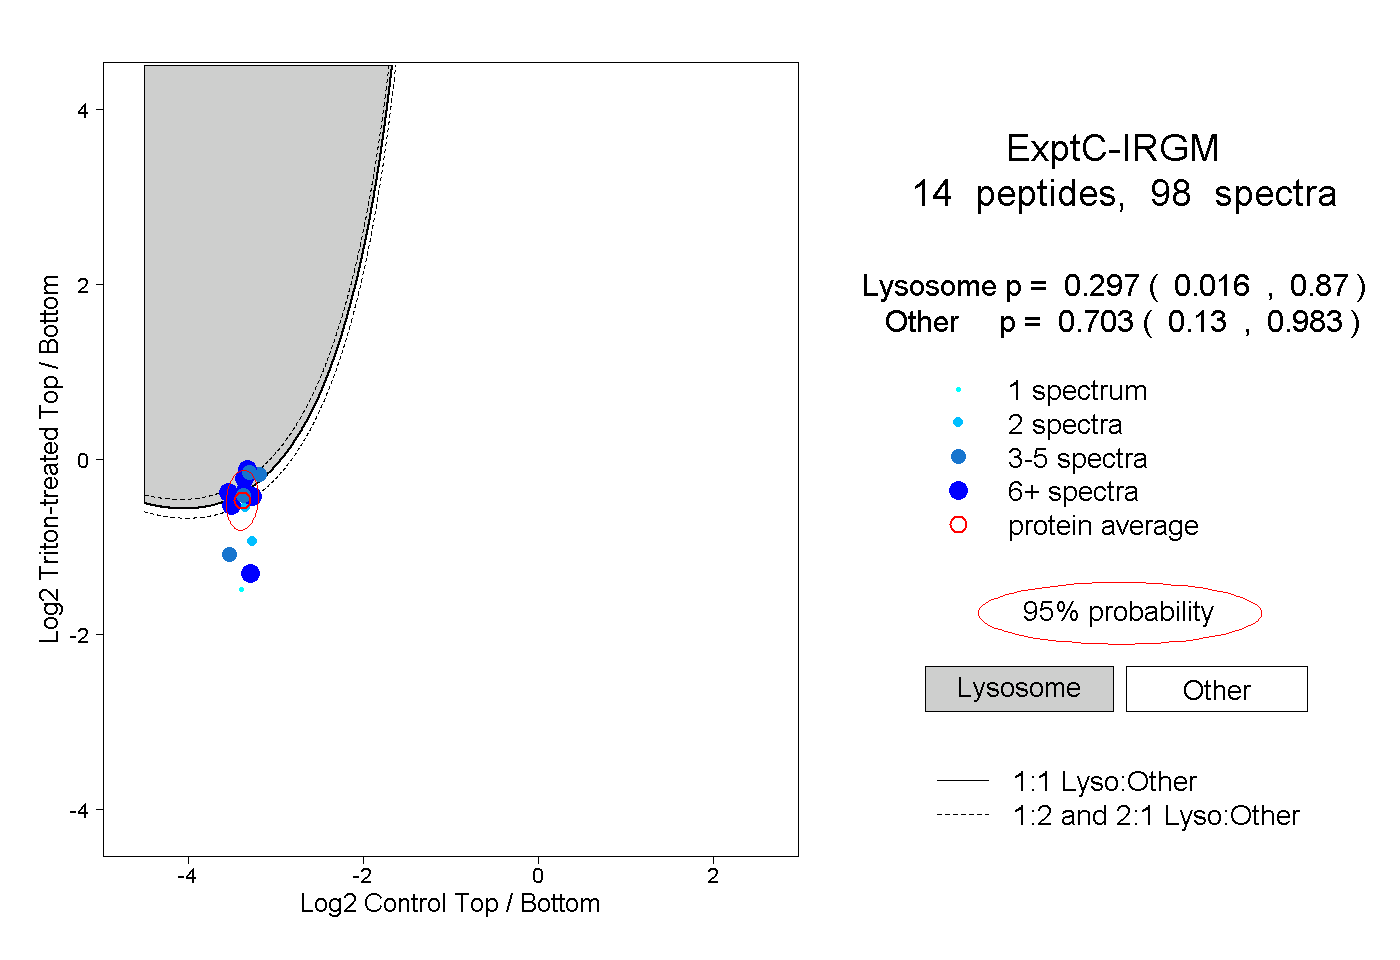
0.016 | 0.870
0.130 | 0.983
4peptides
spectra
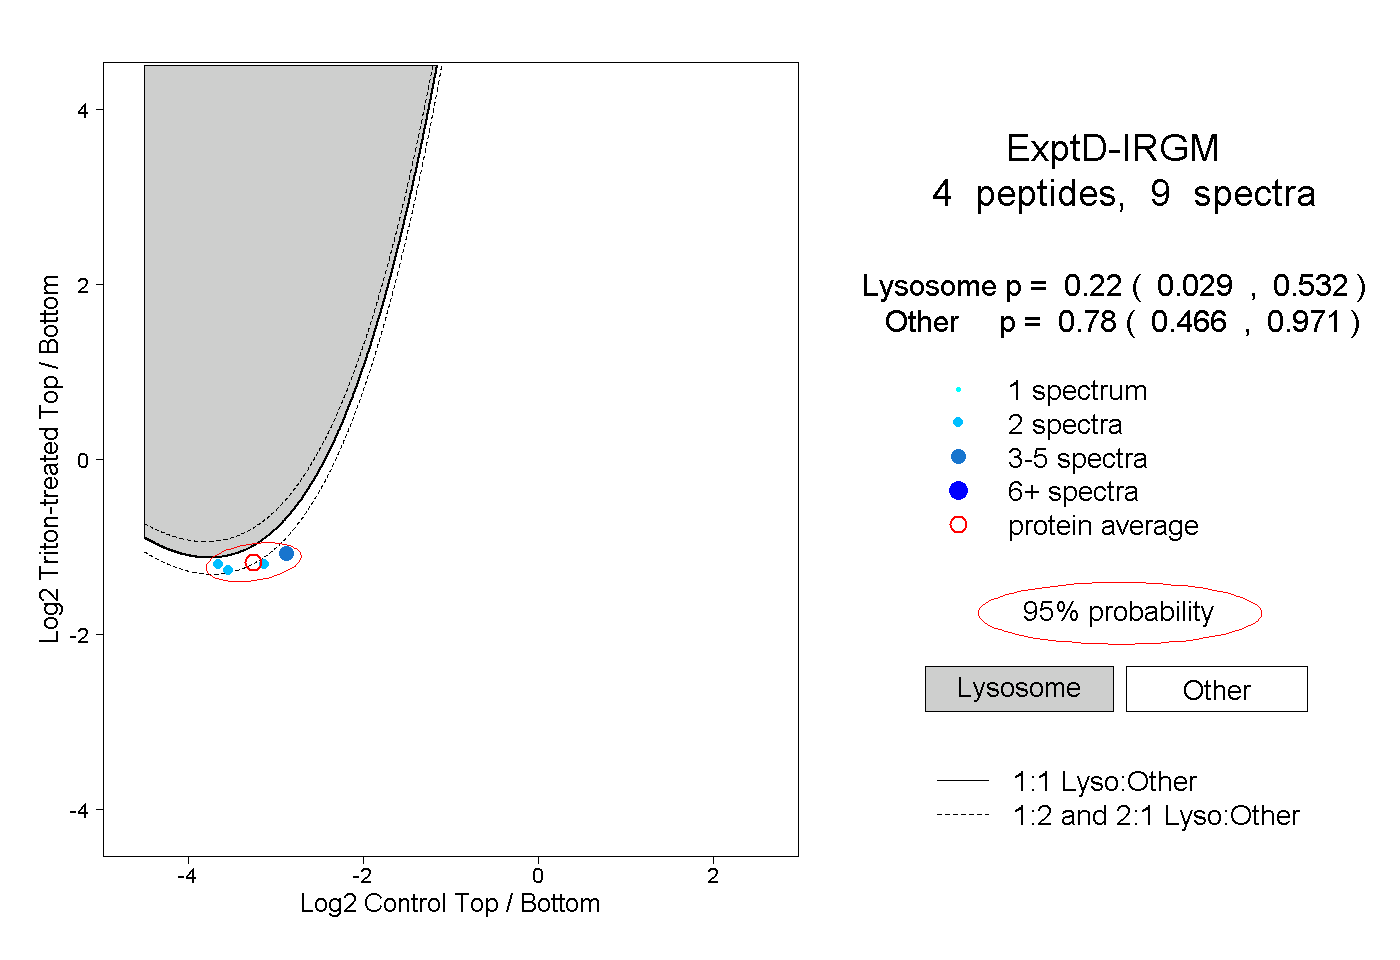
0.029 | 0.532
0.466 | 0.971