 10
10peptides
spectra
0.000 | 0.000
0.351 | 0.378
0.070 | 0.097
0.000 | 0.014
0.000 | 0.000
0.531 | 0.556
0.000 | 0.000
0.000 | 0.000
| Plot | Mito | Lyso | Perox | ER | Golgi | PM | Cytosol | Nucleus | |||||
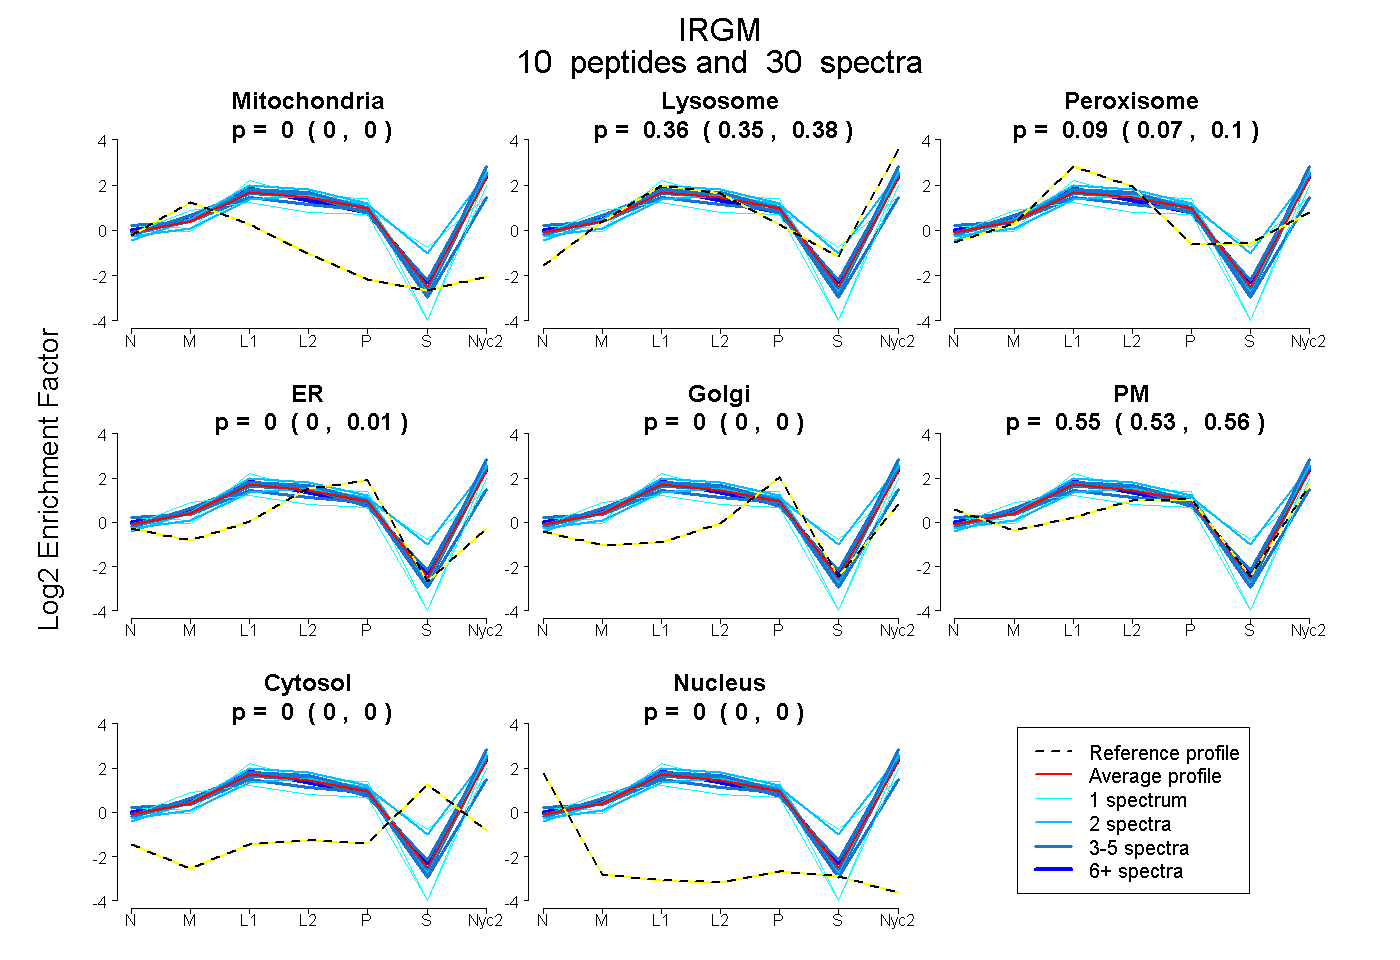
| Expt A |
10 peptides |
30 spectra |
|
0.000 0.000 | 0.000 |
0.365 0.351 | 0.378 |
0.085 0.070 | 0.097 |
0.002 0.000 | 0.014 |
0.000 0.000 | 0.000 |
0.548 0.531 | 0.556 |
0.000 0.000 | 0.000 |
0.000 0.000 | 0.000 |
| 5 spectra, LIQNIQENIR | 0.000 | 0.435 | 0.000 | 0.031 | 0.000 | 0.534 | 0.000 | 0.000 | ||
| 2 spectra, MLLLVAK | 0.000 | 0.564 | 0.000 | 0.117 | 0.000 | 0.319 | 0.000 | 0.000 | ||
| 4 spectra, FYVIWTK | 0.000 | 0.465 | 0.091 | 0.000 | 0.000 | 0.444 | 0.000 | 0.000 | ||
| 6 spectra, DLSTSVLSEVR | 0.000 | 0.375 | 0.126 | 0.000 | 0.000 | 0.498 | 0.000 | 0.000 | ||
| 2 spectra, NTLQTDLSNIR | 0.000 | 0.492 | 0.094 | 0.036 | 0.005 | 0.373 | 0.000 | 0.000 | ||
| 4 spectra, VANWNQIIANGR | 0.000 | 0.506 | 0.000 | 0.000 | 0.000 | 0.494 | 0.000 | 0.000 | ||
| 1 spectrum, CCEPLK | 0.000 | 0.146 | 0.471 | 0.000 | 0.174 | 0.209 | 0.000 | 0.000 | ||
| 1 spectrum, EVPIFLVSNLDPLLHDFPELR | 0.000 | 0.284 | 0.000 | 0.034 | 0.000 | 0.682 | 0.000 | 0.000 | ||
| 1 spectrum, TLYVIYEK | 0.132 | 0.236 | 0.000 | 0.000 | 0.000 | 0.633 | 0.000 | 0.000 | ||
| 4 spectra, IIGHEEDASAPTGVVR | 0.058 | 0.119 | 0.128 | 0.058 | 0.000 | 0.636 | 0.000 | 0.000 |
| Plot | Mito | Lyso or Perox | ER | Golgi | PM | Cytosol | Nucleus | ||||||
| Expt B |
5 peptides |
16 spectra |
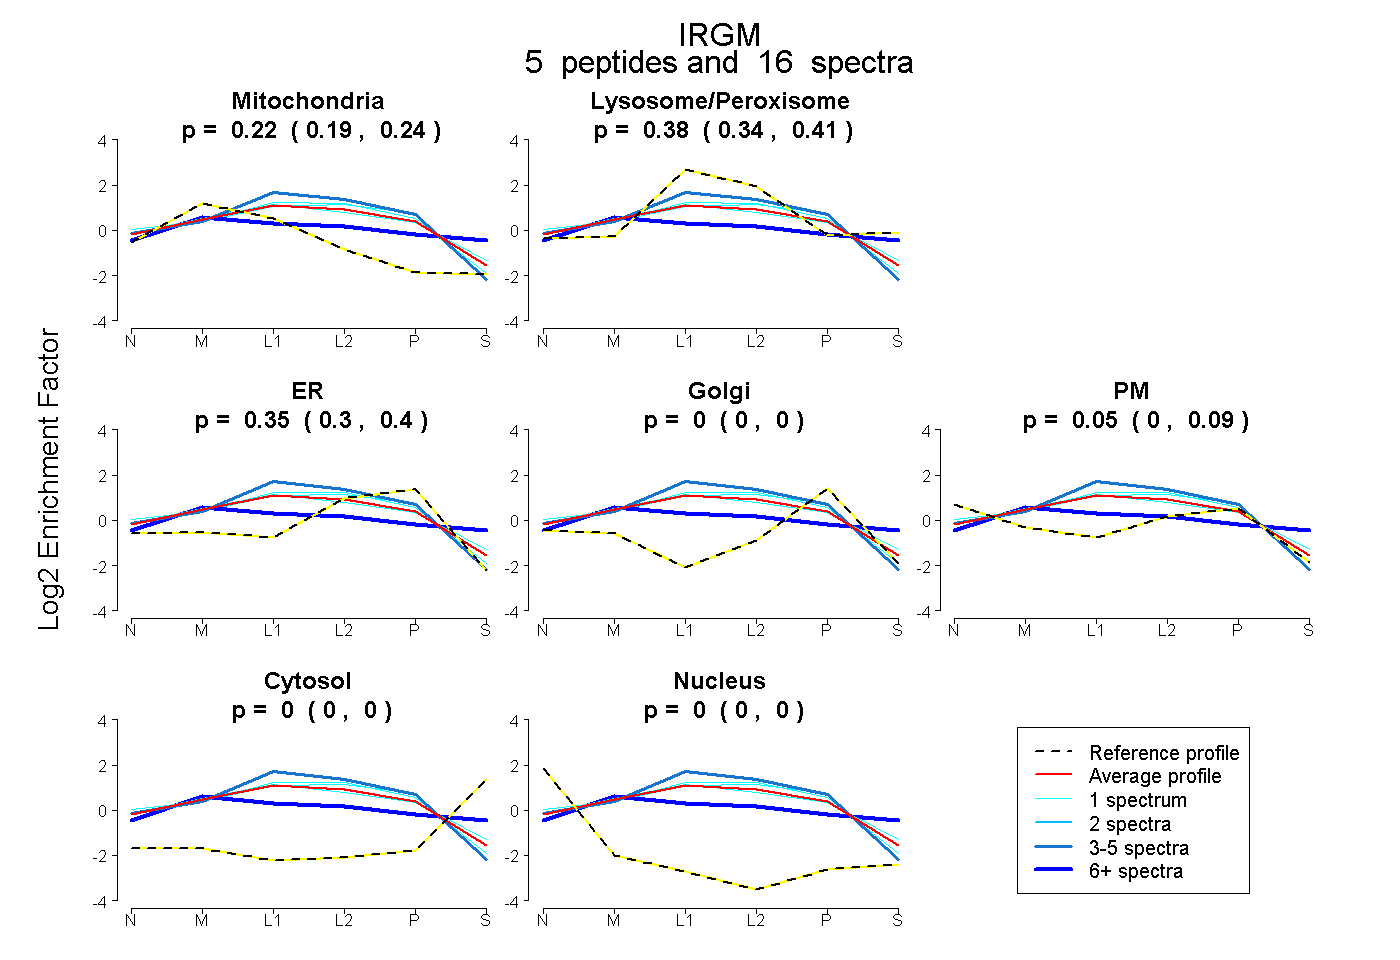 |
0.216 0.186 | 0.239 |
0.380 0.344 | 0.408 |
0.353 0.301 | 0.398 |
0.000 0.000 | 0.000 |
0.052 0.003 | 0.092 |
0.000 0.000 | 0.000 |
0.000 0.000 | 0.000 |
|||
| Plot | Lyso | Other | |||||||||||
| Expt C |
14 peptides |
98 spectra |
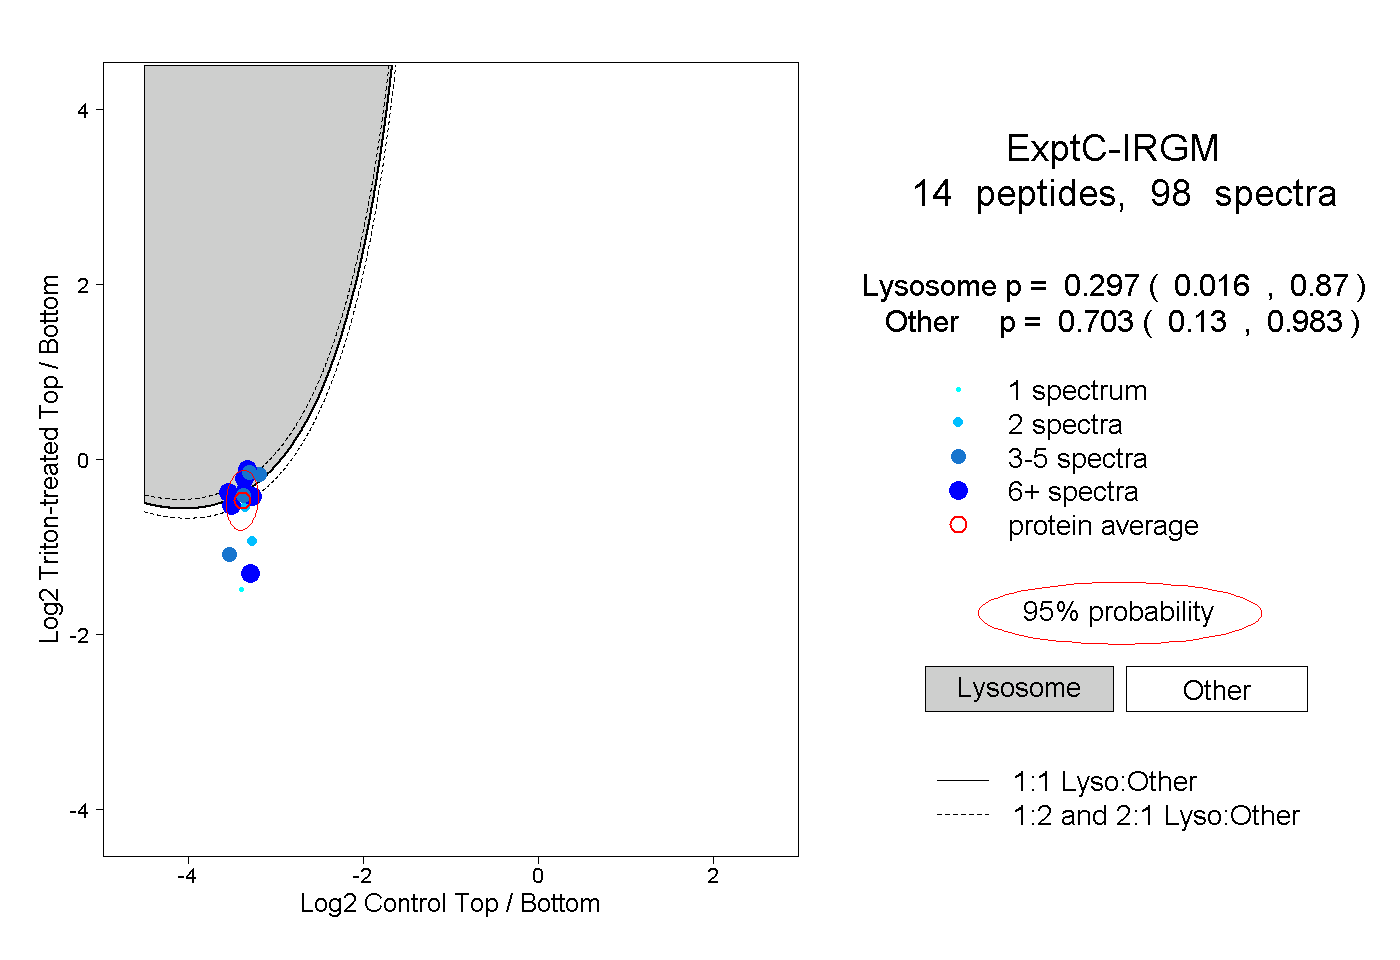 |
0.297 0.016 | 0.870 |
0.703 0.130 | 0.983 |
||||||||
| Plot | Lyso | Other | |||||||||||
| Expt D |
4 peptides |
9 spectra |
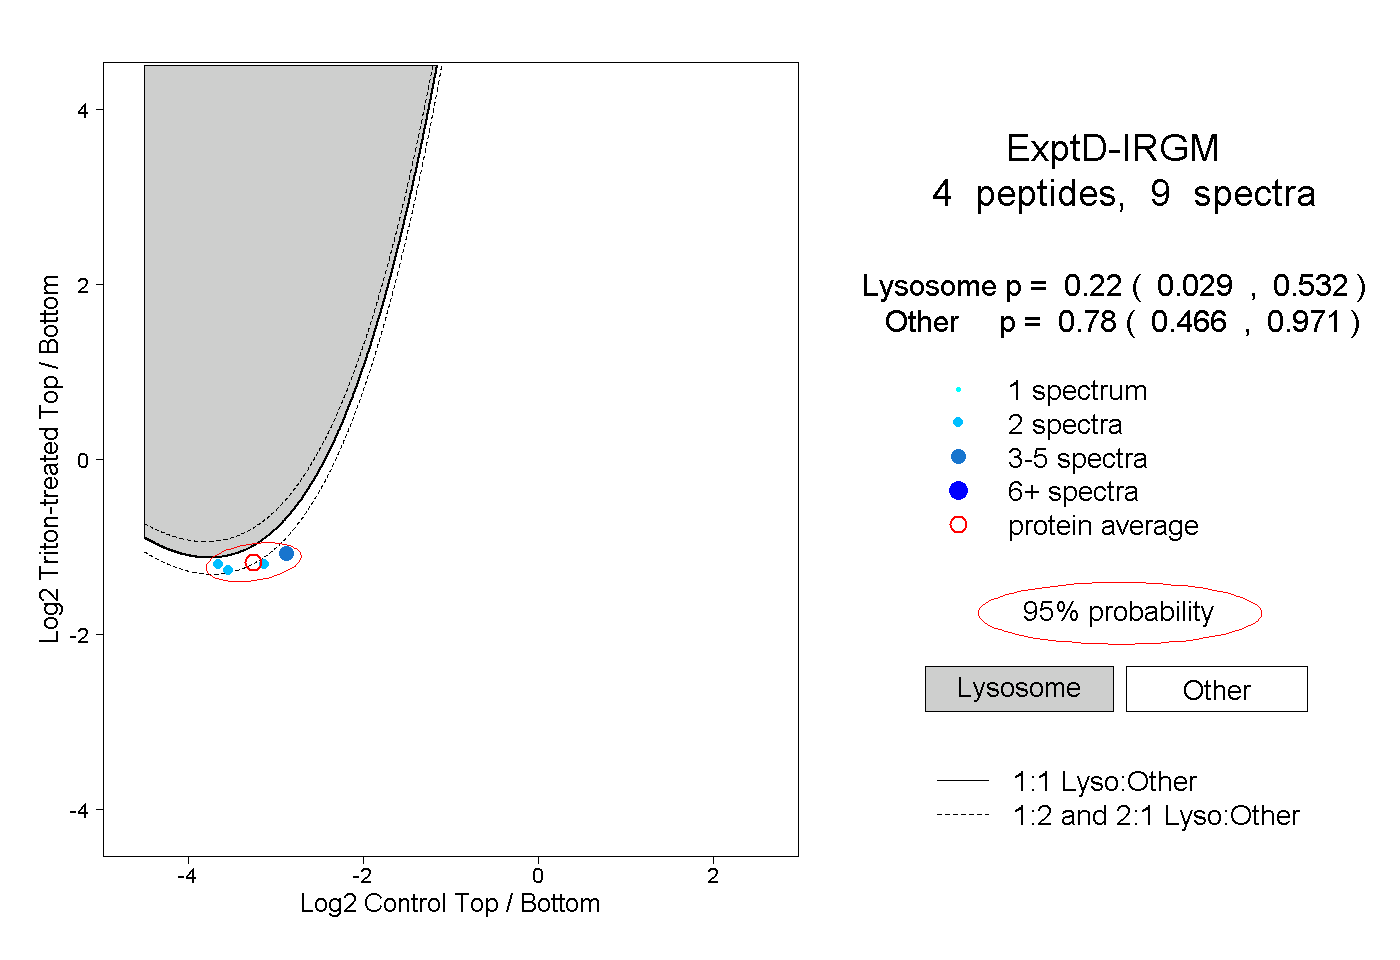 |
0.220 0.029 | 0.532 |
0.780 0.466 | 0.971 |