 6
6peptides
spectra
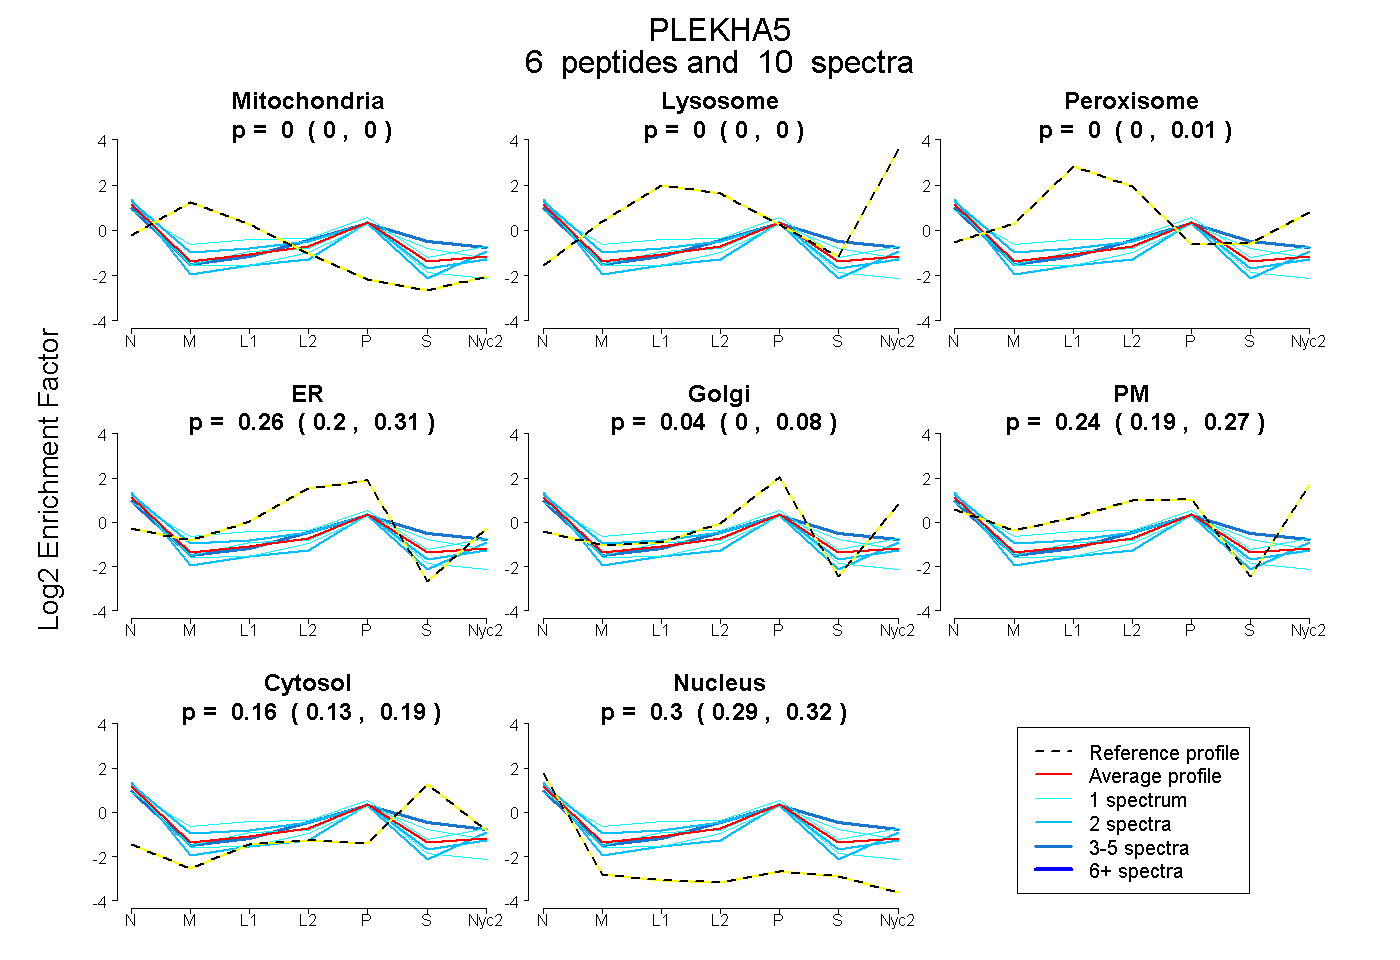
0.000 | 0.000
0.000 | 0.000
0.000 | 0.005
0.200 | 0.307
0.000 | 0.079
0.192 | 0.273
0.129 | 0.187
0.288 | 0.318
1peptide
spectrum
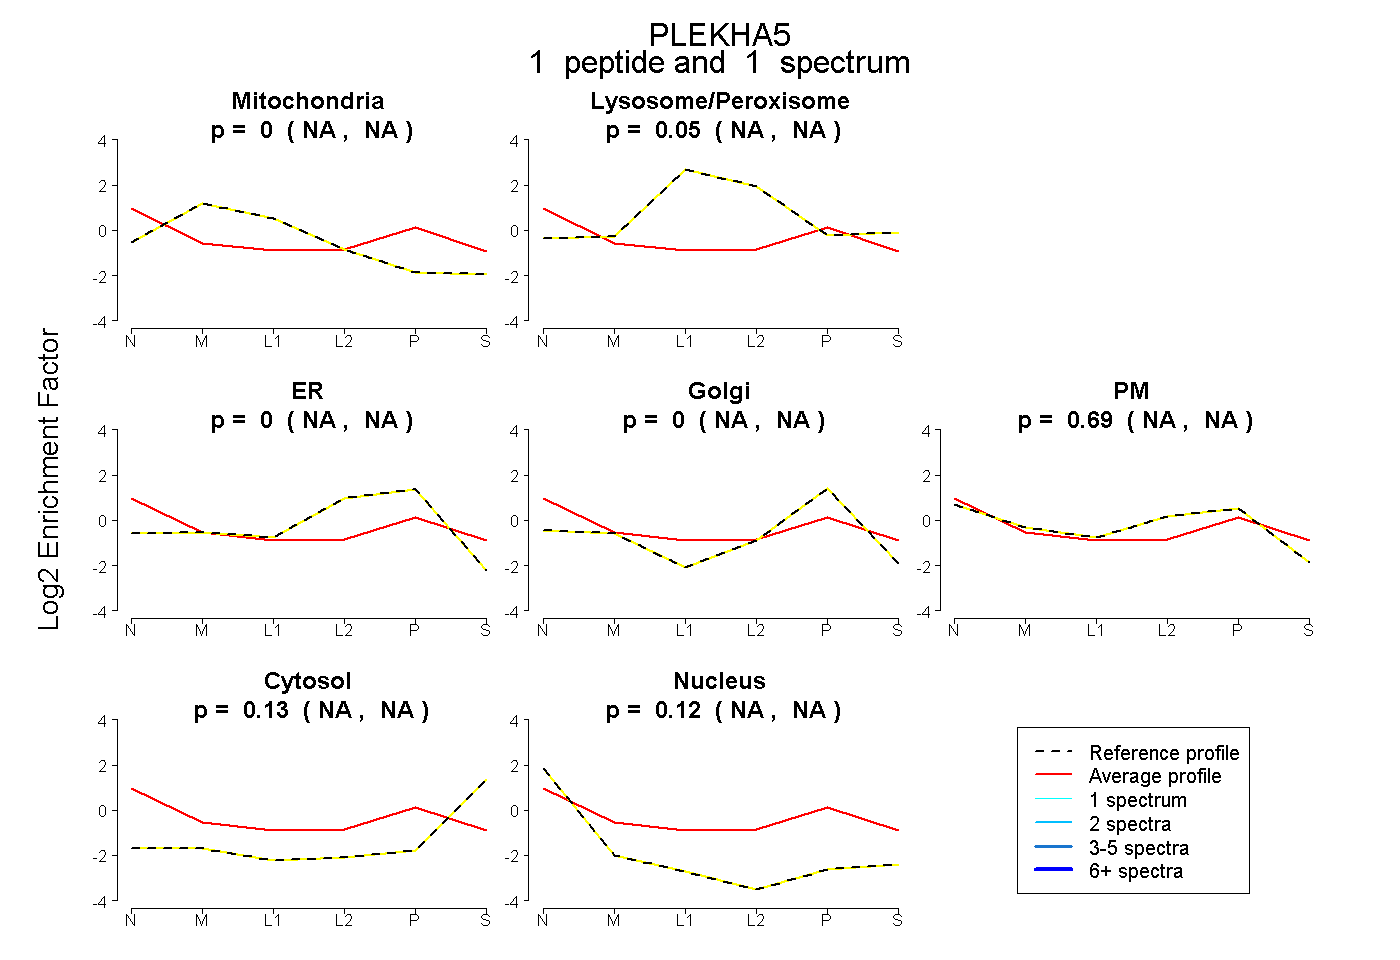
NA | NA
NA | NA
NA | NA
NA | NA
NA | NA
NA | NA
NA | NA
3peptides
spectra
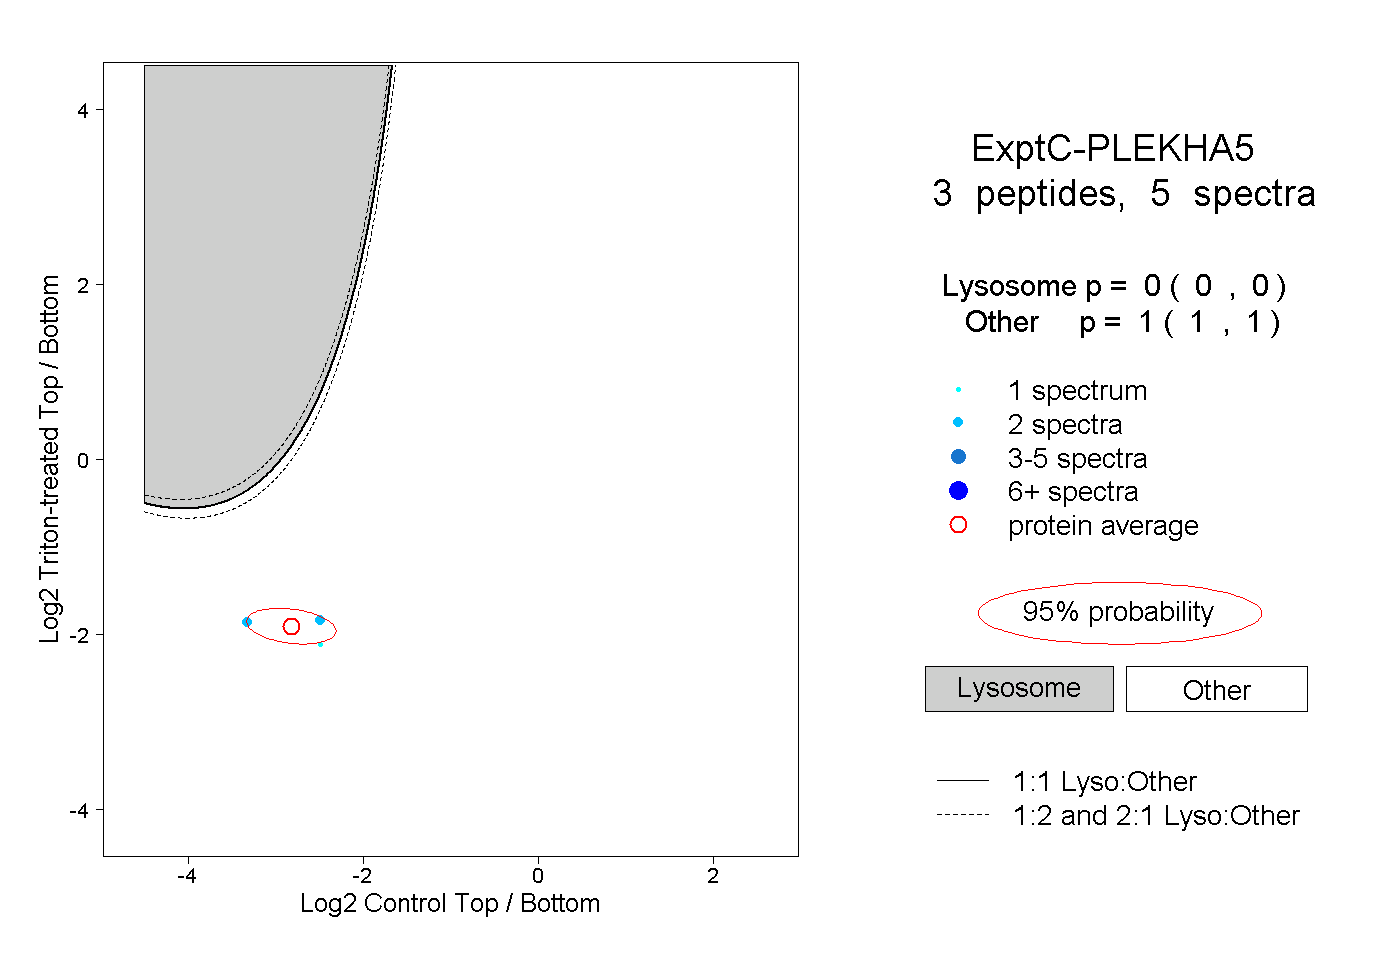
0.000 | 0.000
1.000 | 1.000