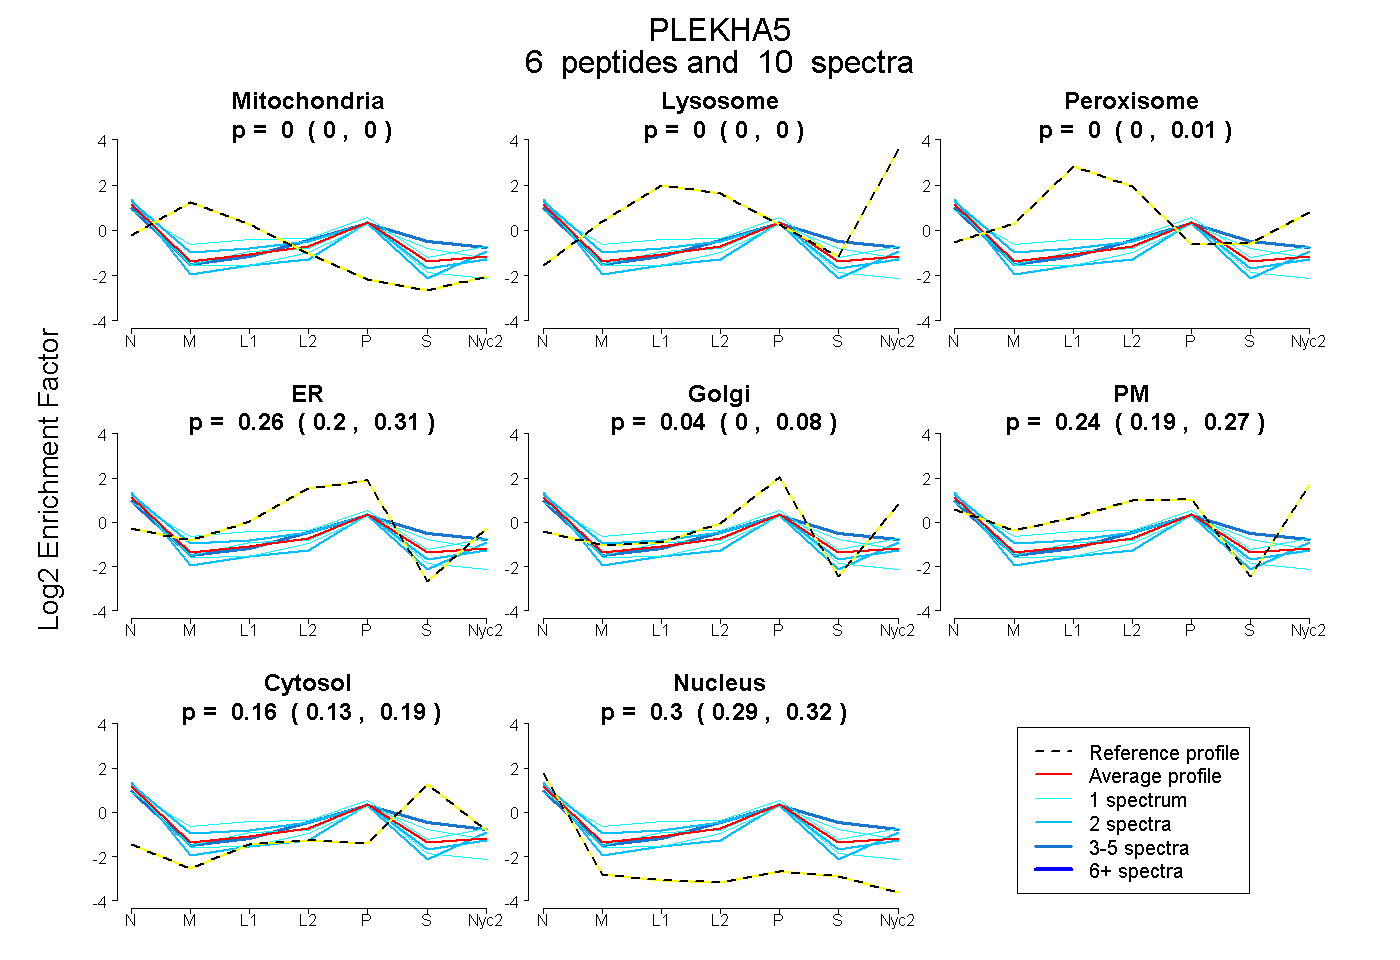
 6
6peptides
spectra
0.000 | 0.000
0.000 | 0.000
0.000 | 0.005
0.200 | 0.307
0.000 | 0.079
0.192 | 0.273
0.129 | 0.187
0.288 | 0.318
| Plot | Mito | Lyso | Perox | ER | Golgi | PM | Cytosol | Nucleus | |||||
| Expt A |
6 peptides |
10 spectra |
|
0.000 0.000 | 0.000 |
0.000 0.000 | 0.000 |
0.000 0.000 | 0.005 |
0.260 0.200 | 0.307 |
0.035 0.000 | 0.079 |
0.239 0.192 | 0.273 |
0.162 0.129 | 0.187 |
0.304 0.288 | 0.318 |
| 1 spectrum, EMELWMK | 0.000 | 0.000 | 0.042 | 0.502 | 0.000 | 0.000 | 0.029 | 0.427 | ||
| 2 spectra, GVISYQTLPR | 0.000 | 0.000 | 0.000 | 0.066 | 0.342 | 0.106 | 0.086 | 0.400 | ||
| 1 spectrum, GGSHPNTGPLATEADR | 0.000 | 0.000 | 0.229 | 0.106 | 0.266 | 0.101 | 0.057 | 0.240 | ||
| 1 spectrum, YRPEEVDIDAK | 0.000 | 0.000 | 0.000 | 0.132 | 0.167 | 0.145 | 0.265 | 0.290 | ||
| 2 spectra, NPNAPVVR | 0.001 | 0.000 | 0.043 | 0.244 | 0.002 | 0.363 | 0.000 | 0.348 | ||
| 3 spectra, ATAELER | 0.000 | 0.000 | 0.000 | 0.171 | 0.000 | 0.298 | 0.347 | 0.184 |
| Plot | Mito | Lyso or Perox | ER | Golgi | PM | Cytosol | Nucleus | ||||||
| Expt B |
1 peptide |
1 spectrum |
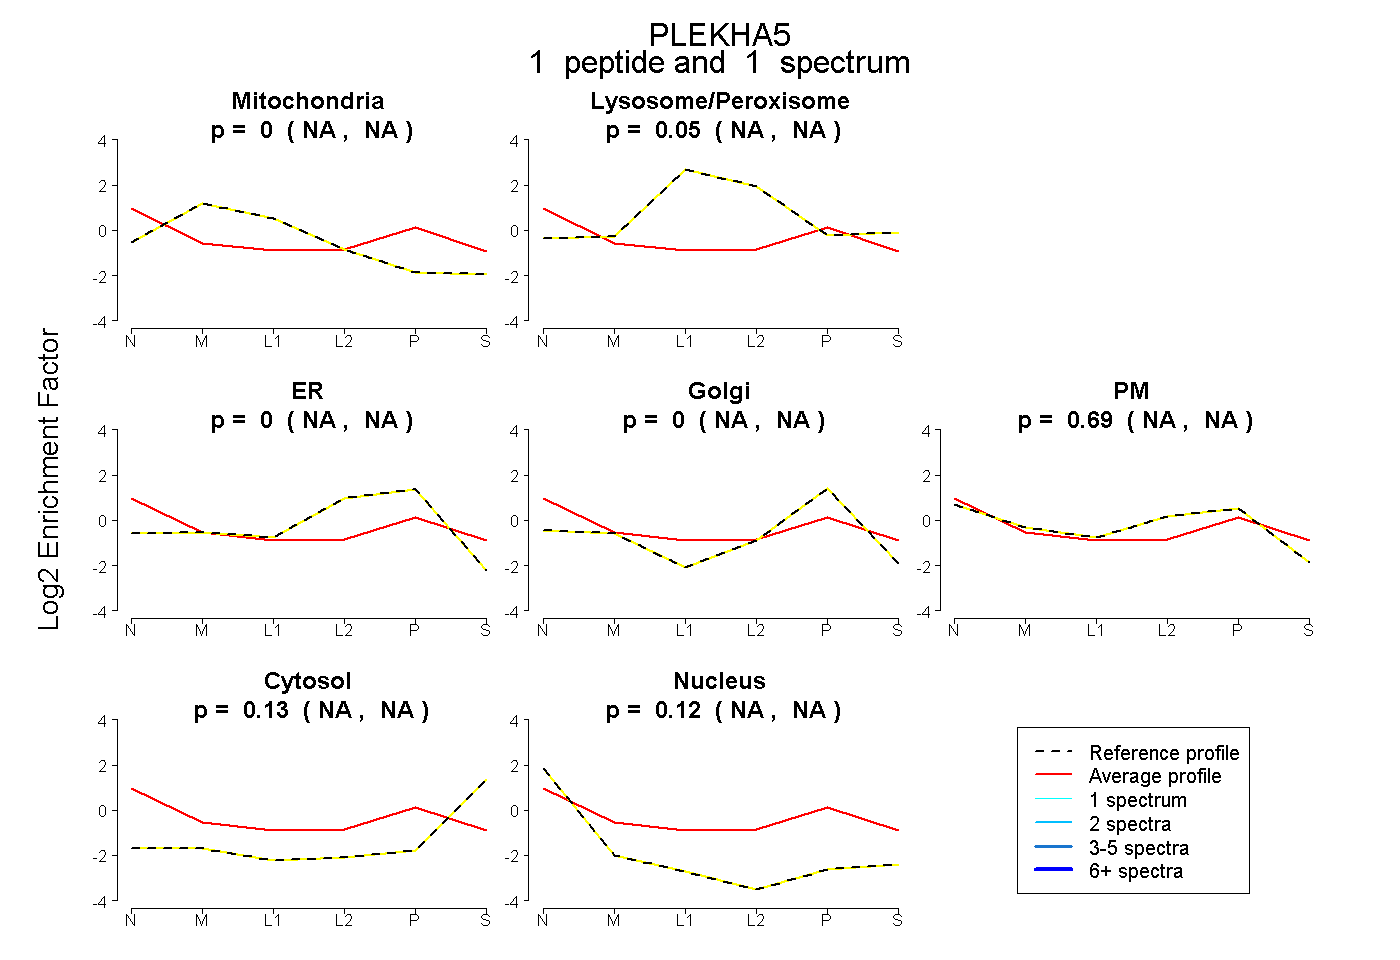 |
0.000 NA | NA |
0.053 NA | NA |
0.000 NA | NA |
0.000 NA | NA |
0.692 NA | NA |
0.132 NA | NA |
0.124 NA | NA |
|||
| Plot | Lyso | Other | |||||||||||
| Expt C |
3 peptides |
5 spectra |
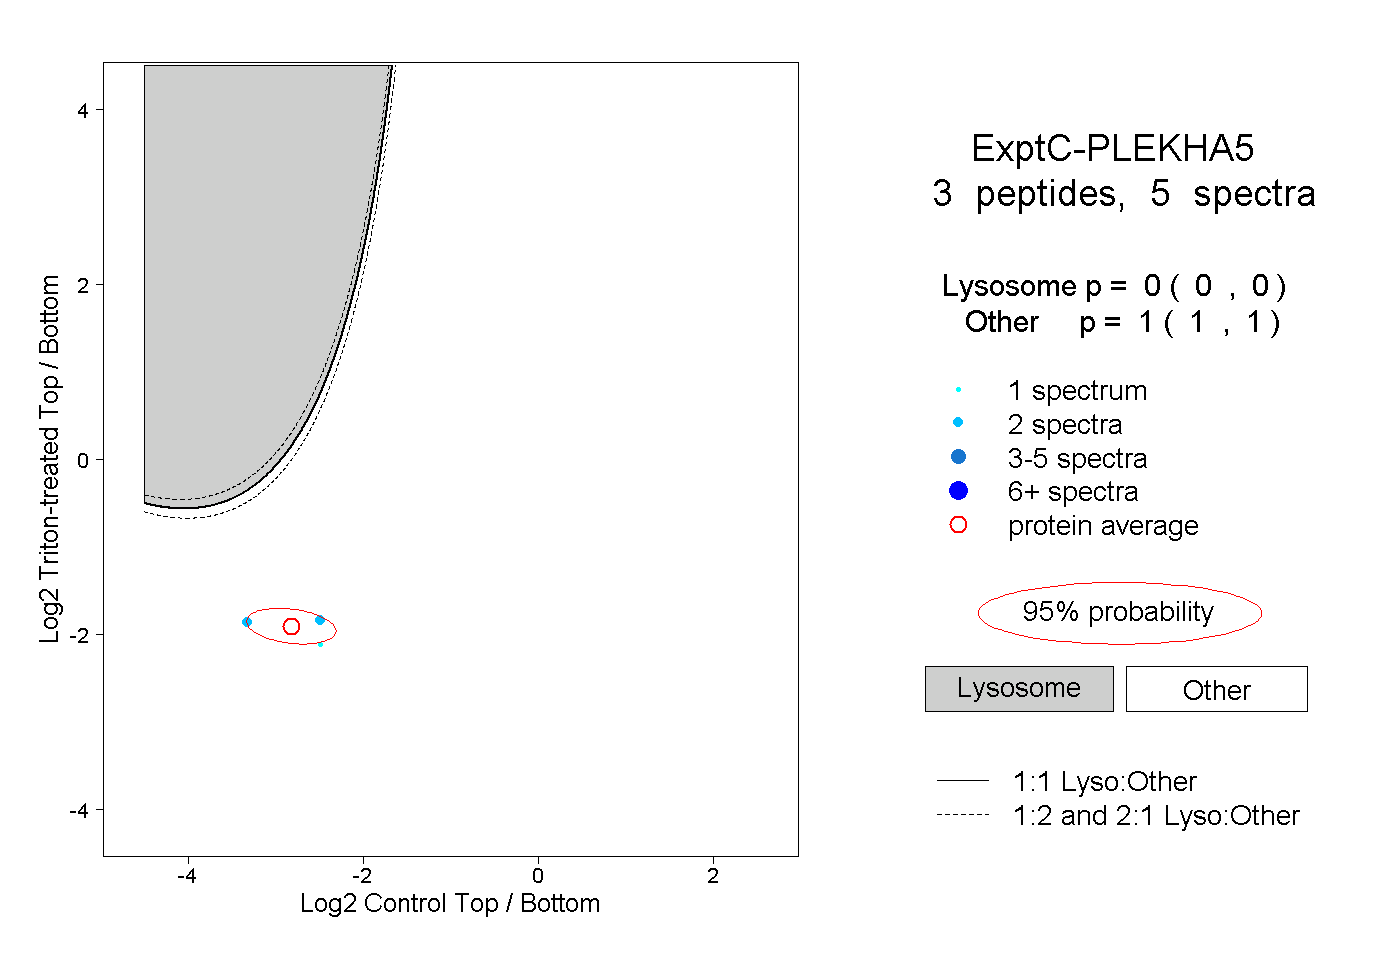 |
0.000 0.000 | 0.000 |
1.000 1.000 | 1.000 |