 8
8peptides
spectra
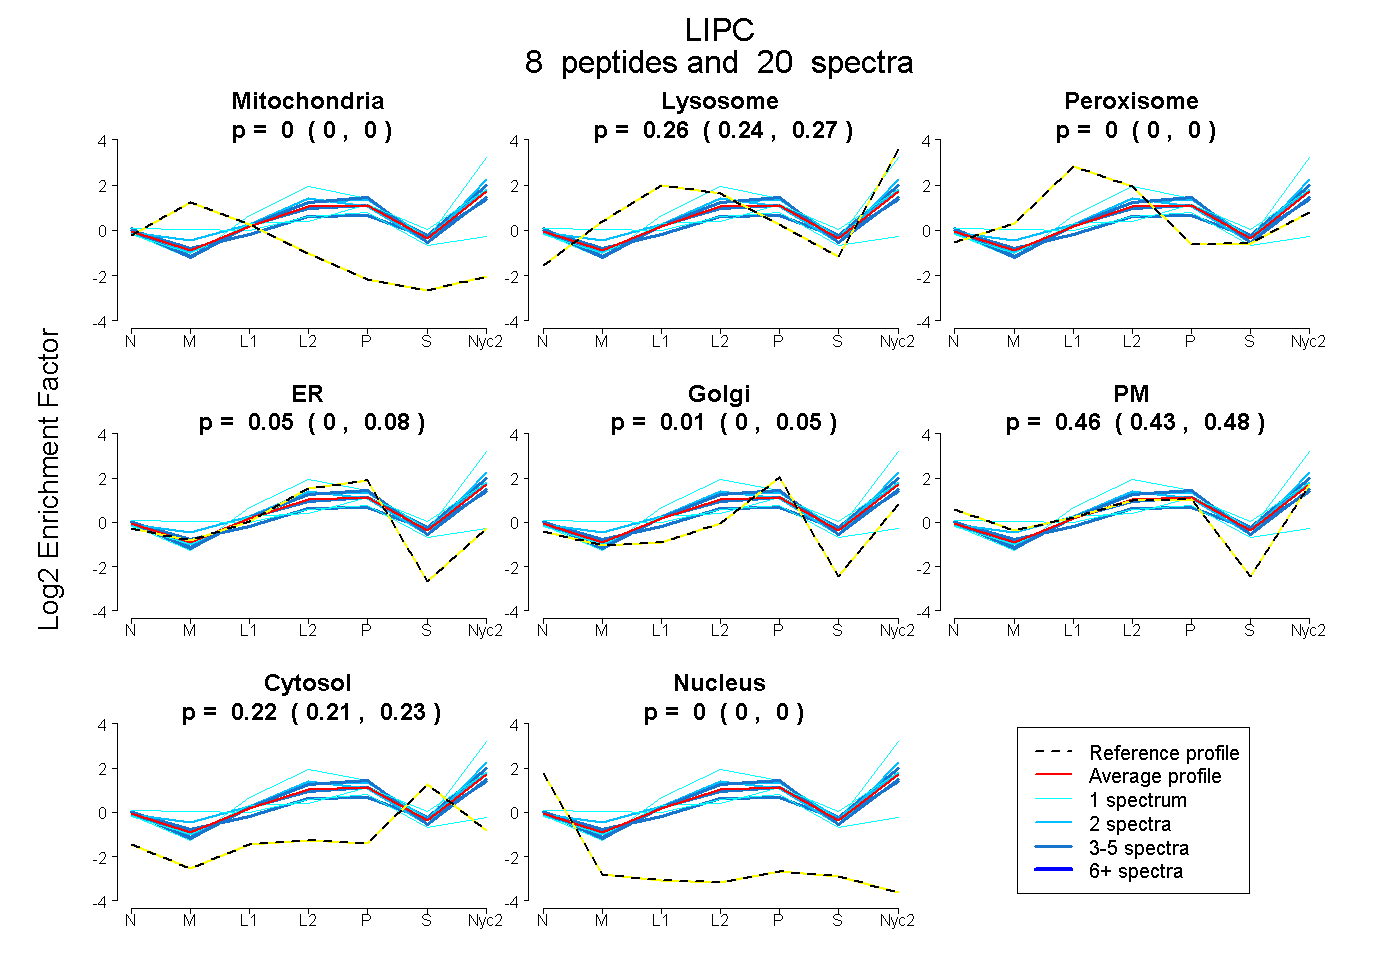
0.000 | 0.000
0.242 | 0.272
0.000 | 0.000
0.000 | 0.083
0.000 | 0.051
0.426 | 0.482
0.210 | 0.231
0.000 | 0.000
2peptides
spectra
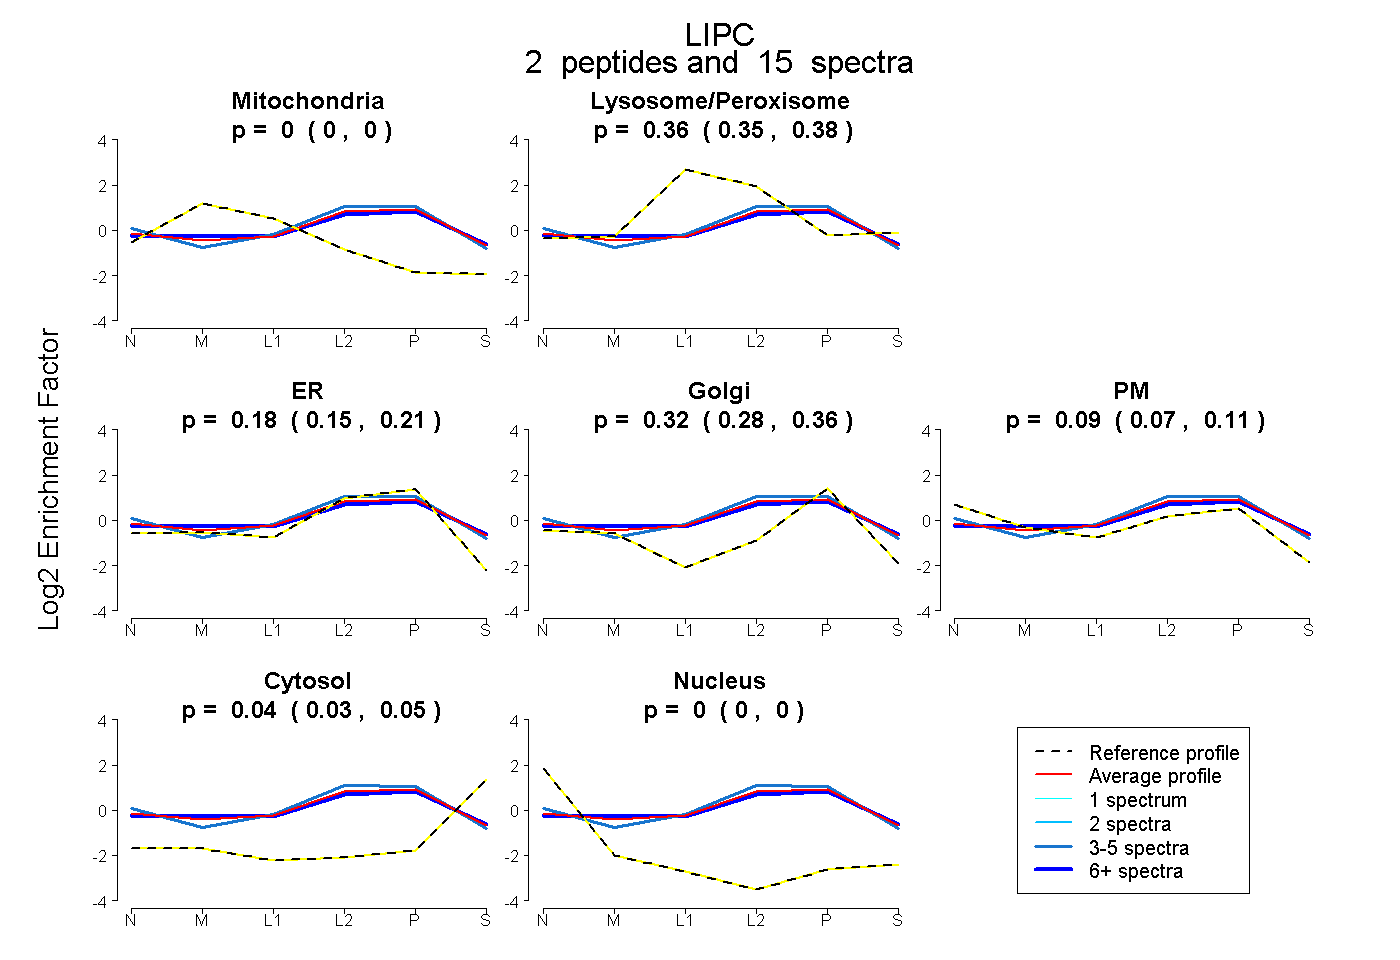
0.000 | 0.000
0.350 | 0.376
0.148 | 0.212
0.284 | 0.356
0.072 | 0.108
0.029 | 0.047
0.000 | 0.000
10peptides
spectra
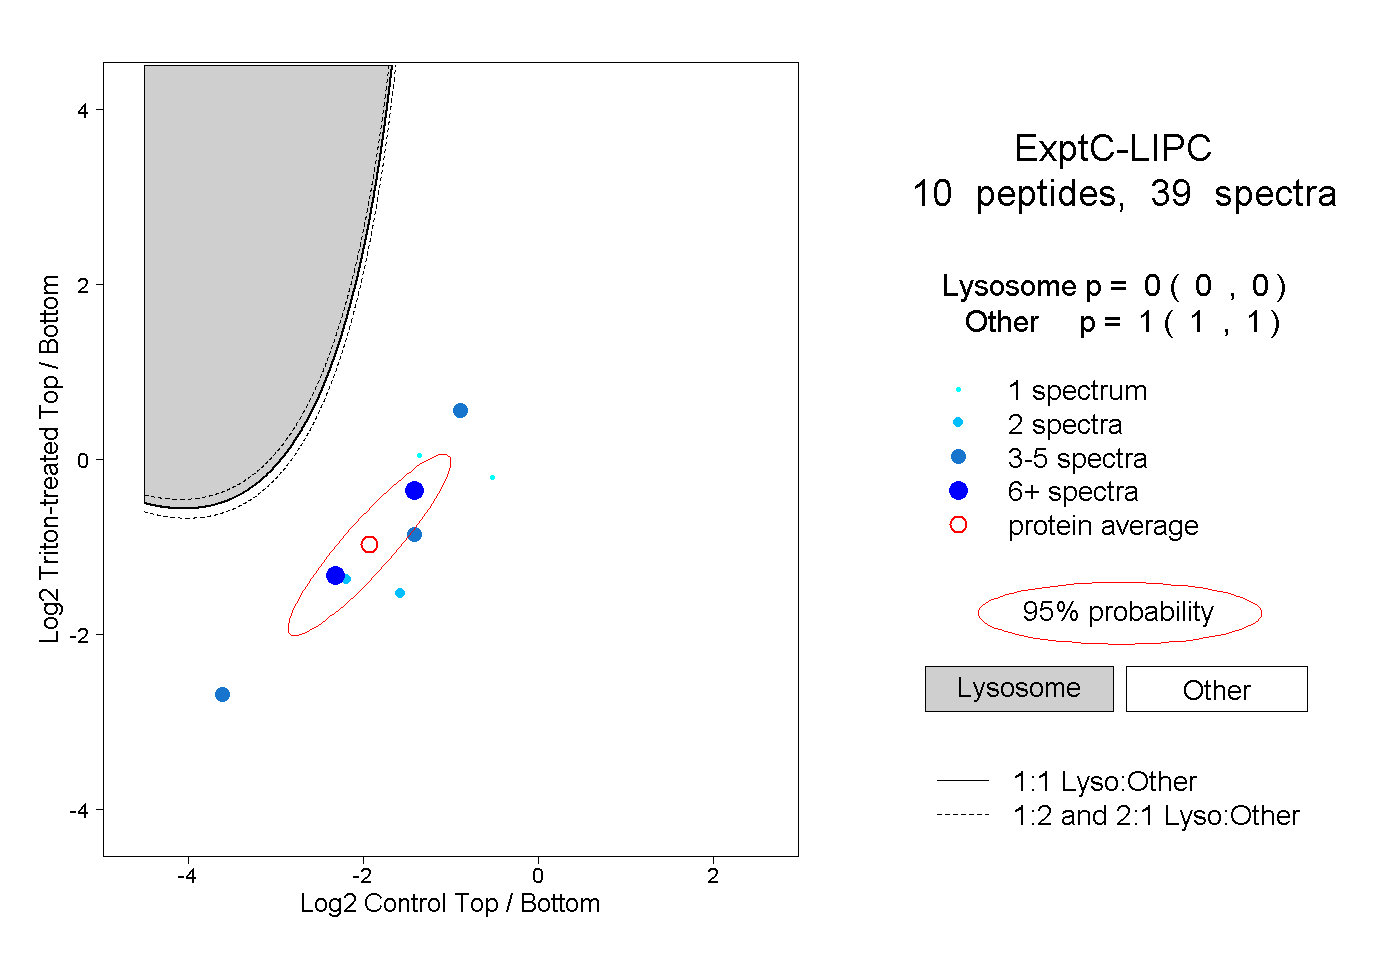
0.000 | 0.000
1.000 | 1.000
1peptide
spectra
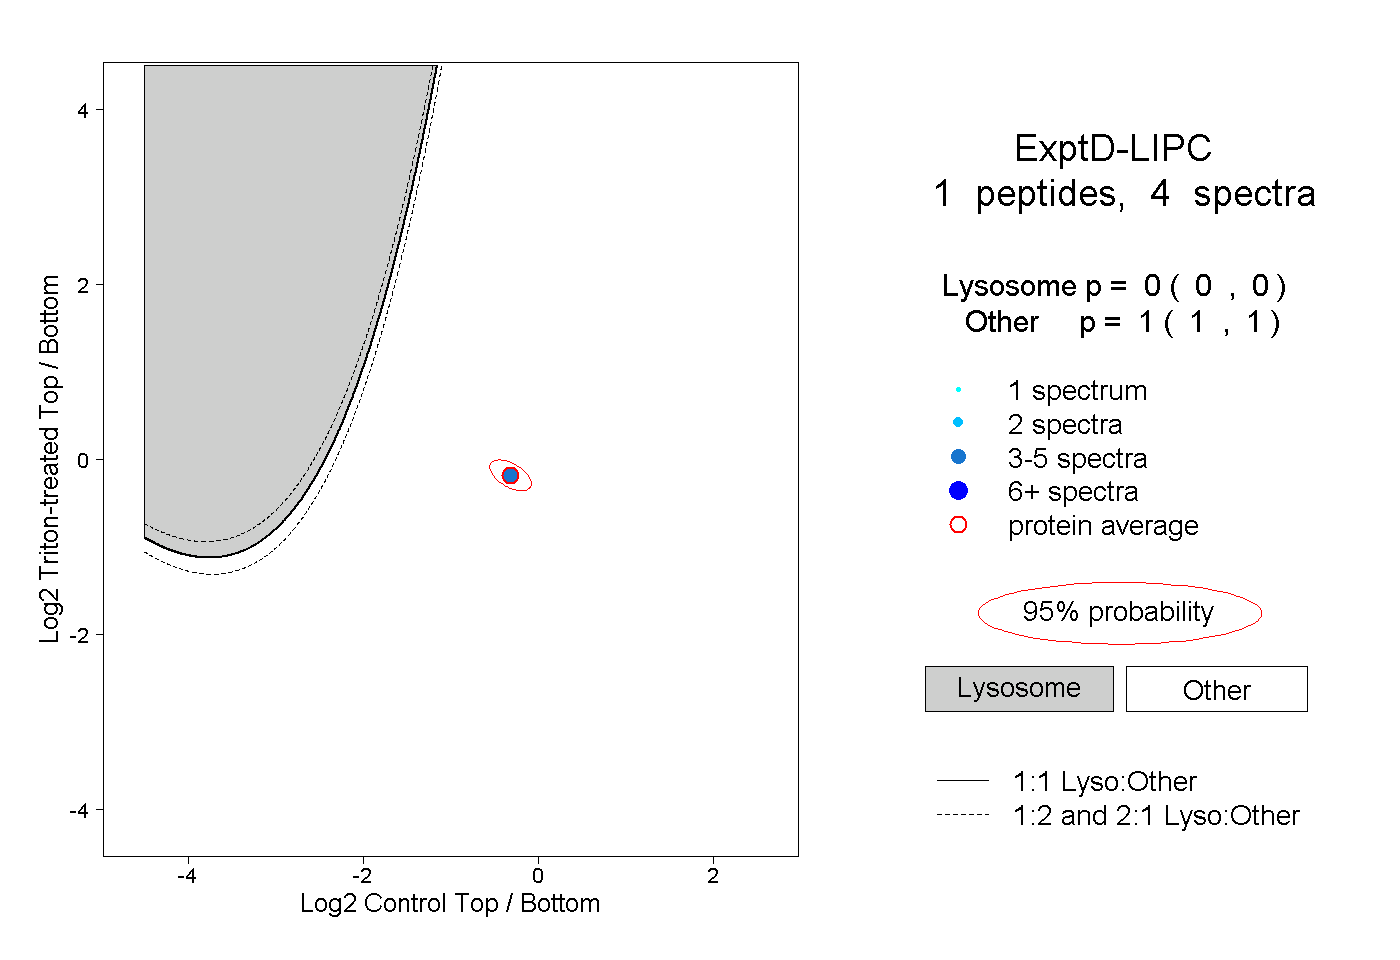
0.000 | 0.000
1.000 | 1.000