 8
8peptides
spectra
0.000 | 0.000
0.242 | 0.272
0.000 | 0.000
0.000 | 0.083
0.000 | 0.051
0.426 | 0.482
0.210 | 0.231
0.000 | 0.000
| Plot | Mito | Lyso | Perox | ER | Golgi | PM | Cytosol | Nucleus | |||||
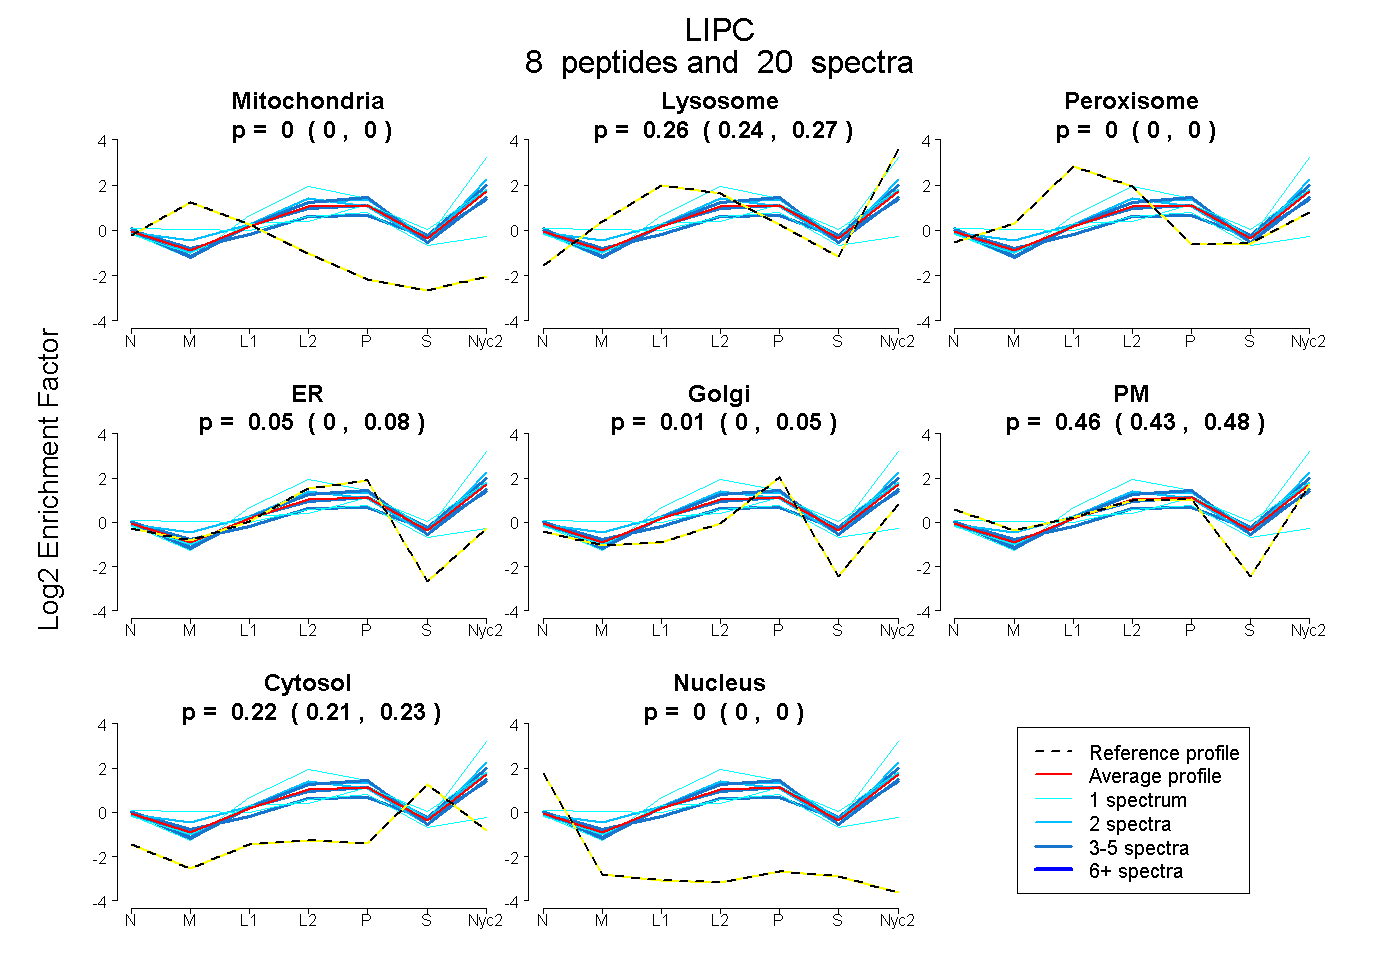
| Expt A |
8 peptides |
20 spectra |
|
0.000 0.000 | 0.000 |
0.258 0.242 | 0.272 |
0.000 0.000 | 0.000 |
0.047 0.000 | 0.083 |
0.015 0.000 | 0.051 |
0.458 0.426 | 0.482 |
0.222 0.210 | 0.231 |
0.000 0.000 | 0.000 |
| 1 spectrum, VYHYQFK | 0.000 | 0.333 | 0.000 | 0.000 | 0.149 | 0.246 | 0.273 | 0.000 | ||
| 5 spectra, NLGATEER | 0.000 | 0.224 | 0.000 | 0.216 | 0.016 | 0.353 | 0.191 | 0.000 | ||
| 2 spectra, LSPDDANFVDAIHTFTR | 0.000 | 0.364 | 0.000 | 0.000 | 0.000 | 0.495 | 0.141 | 0.000 | ||
| 1 spectrum, MTFCPDNVDDLQLHPTQEK | 0.091 | 0.000 | 0.206 | 0.299 | 0.104 | 0.105 | 0.194 | 0.000 | ||
| 3 spectra, AQSPFK | 0.000 | 0.271 | 0.000 | 0.000 | 0.006 | 0.489 | 0.235 | 0.000 | ||
| 5 spectra, IVGALK | 0.000 | 0.171 | 0.000 | 0.000 | 0.000 | 0.520 | 0.309 | 0.000 | ||
| 2 spectra, CNSLGYDIR | 0.000 | 0.318 | 0.000 | 0.103 | 0.066 | 0.322 | 0.191 | 0.000 | ||
| 1 spectrum, ITGLDPAGPMFEGTSPNER | 0.000 | 0.529 | 0.000 | 0.000 | 0.024 | 0.371 | 0.076 | 0.000 |
| Plot | Mito | Lyso or Perox | ER | Golgi | PM | Cytosol | Nucleus | ||||||
| Expt B |
2 peptides |
15 spectra |
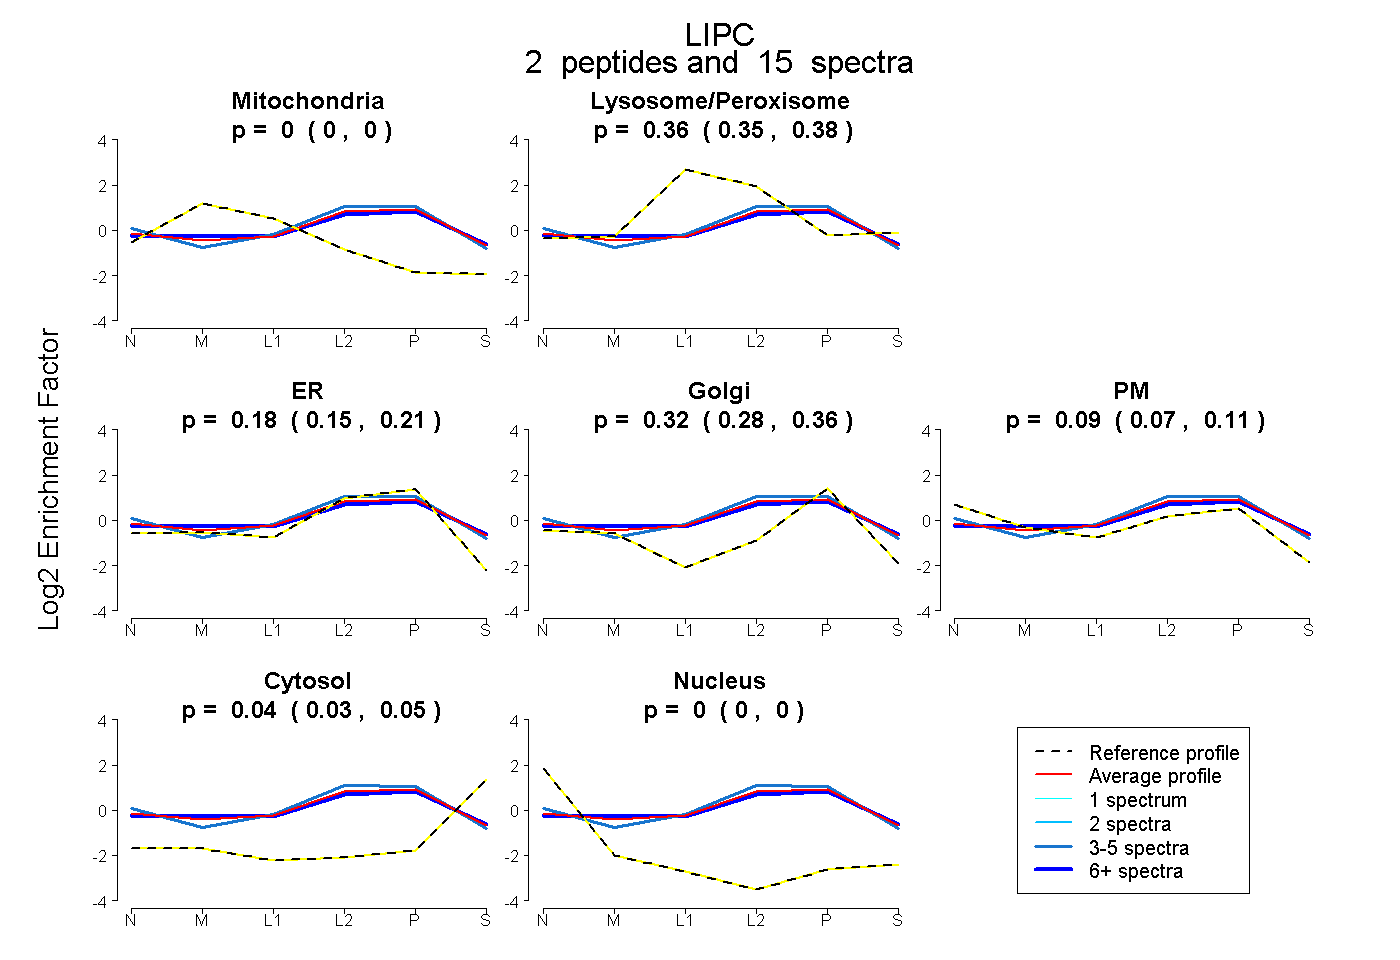 |
0.000 0.000 | 0.000 |
0.365 0.350 | 0.376 |
0.181 0.148 | 0.212 |
0.324 0.284 | 0.356 |
0.091 0.072 | 0.108 |
0.039 0.029 | 0.047 |
0.000 0.000 | 0.000 |
|||
| Plot | Lyso | Other | |||||||||||
| Expt C |
10 peptides |
39 spectra |
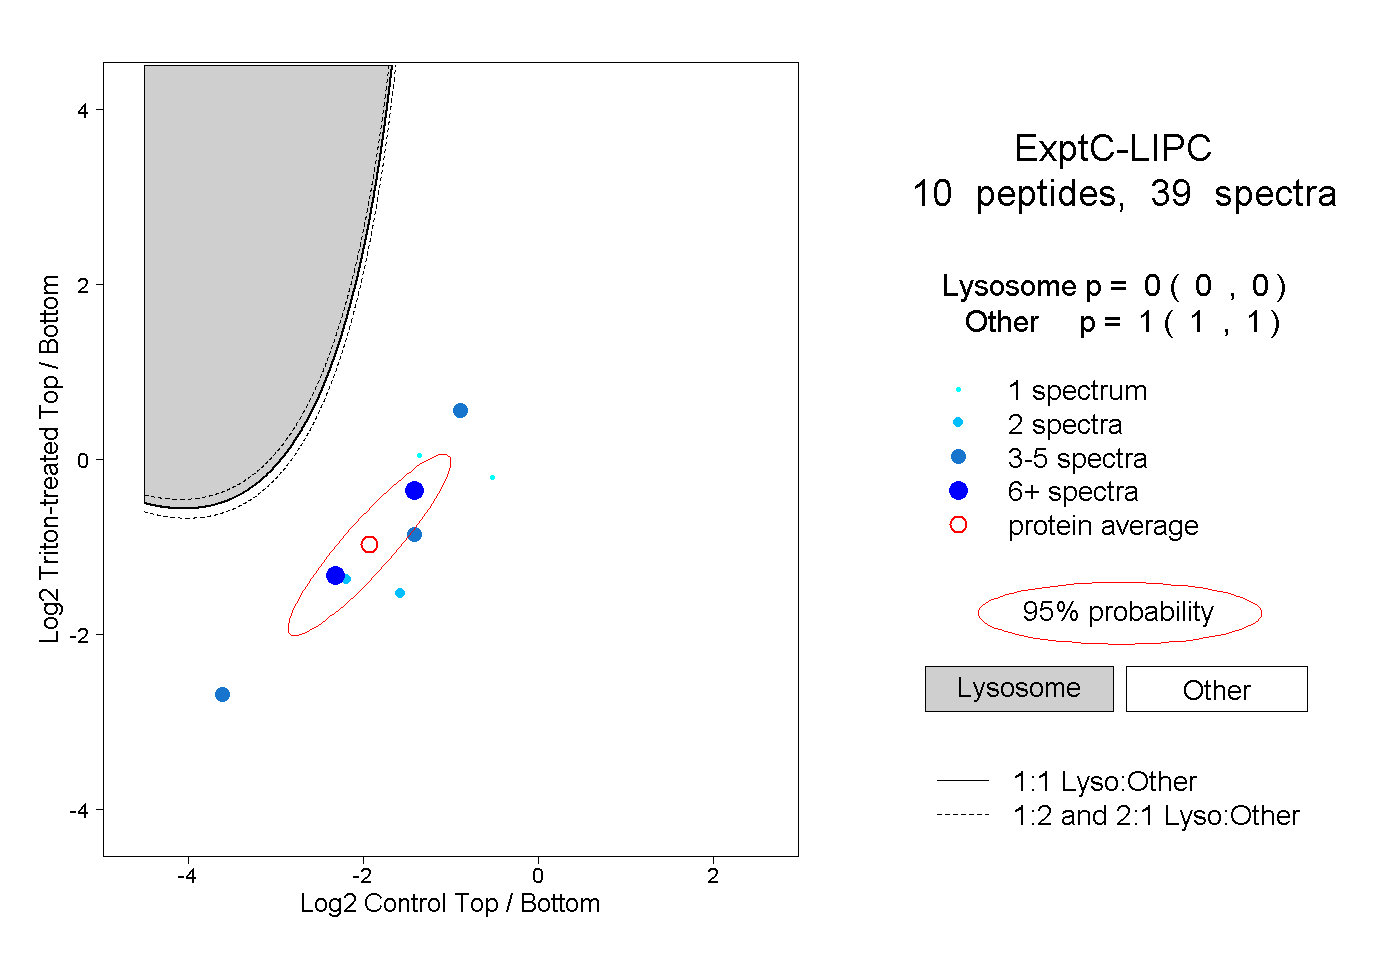 |
0.000 0.000 | 0.000 |
1.000 1.000 | 1.000 |
||||||||
| Plot | Lyso | Other | |||||||||||
| Expt D |
1 peptide |
4 spectra |
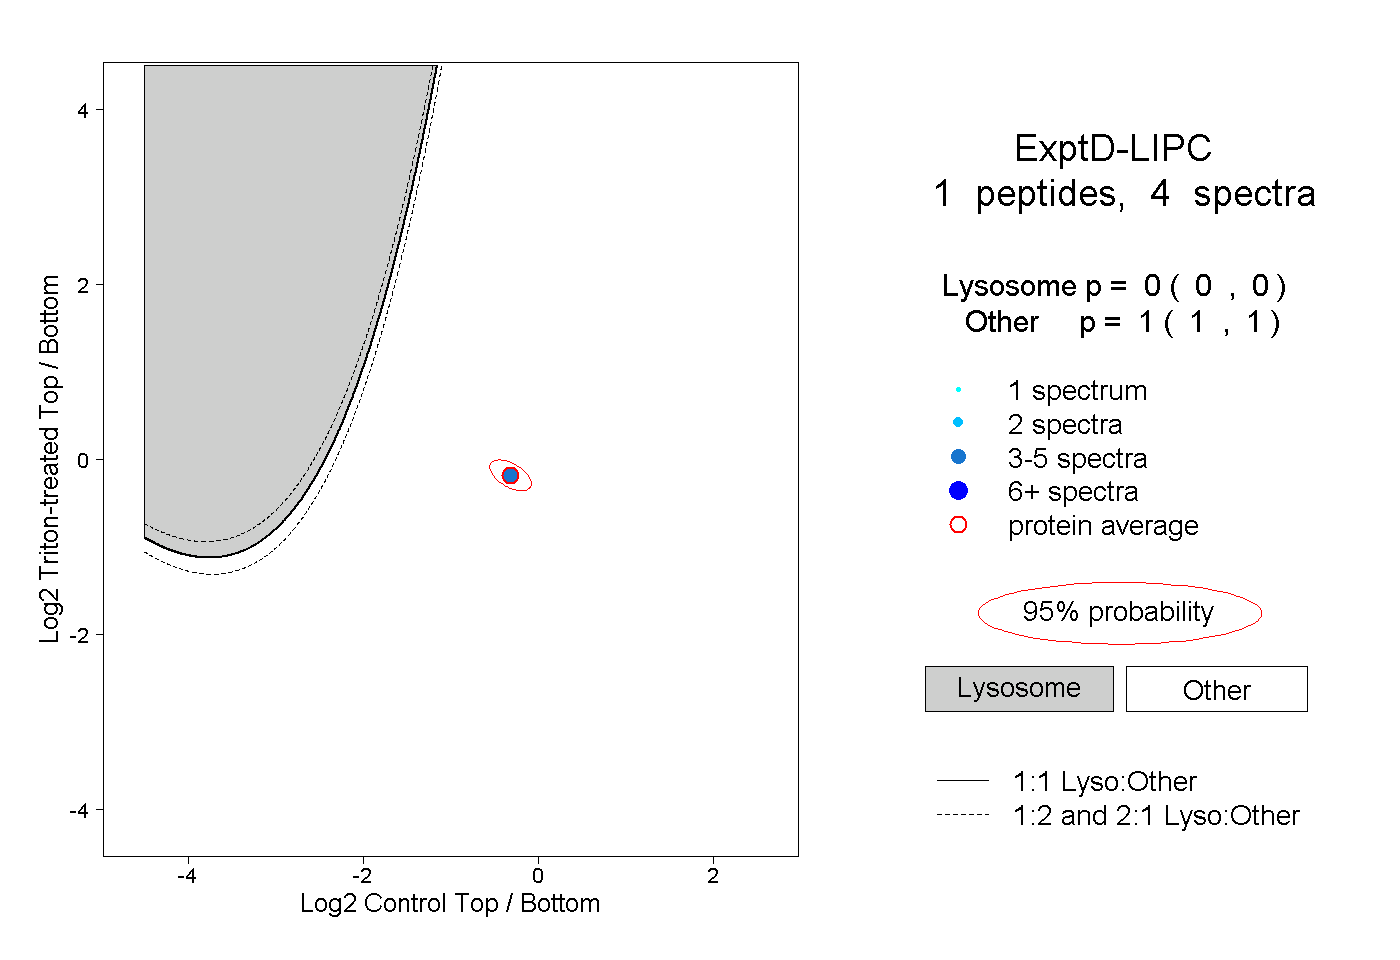 |
0.000 0.000 | 0.000 |
1.000 1.000 | 1.000 |