 5
5peptides
spectra
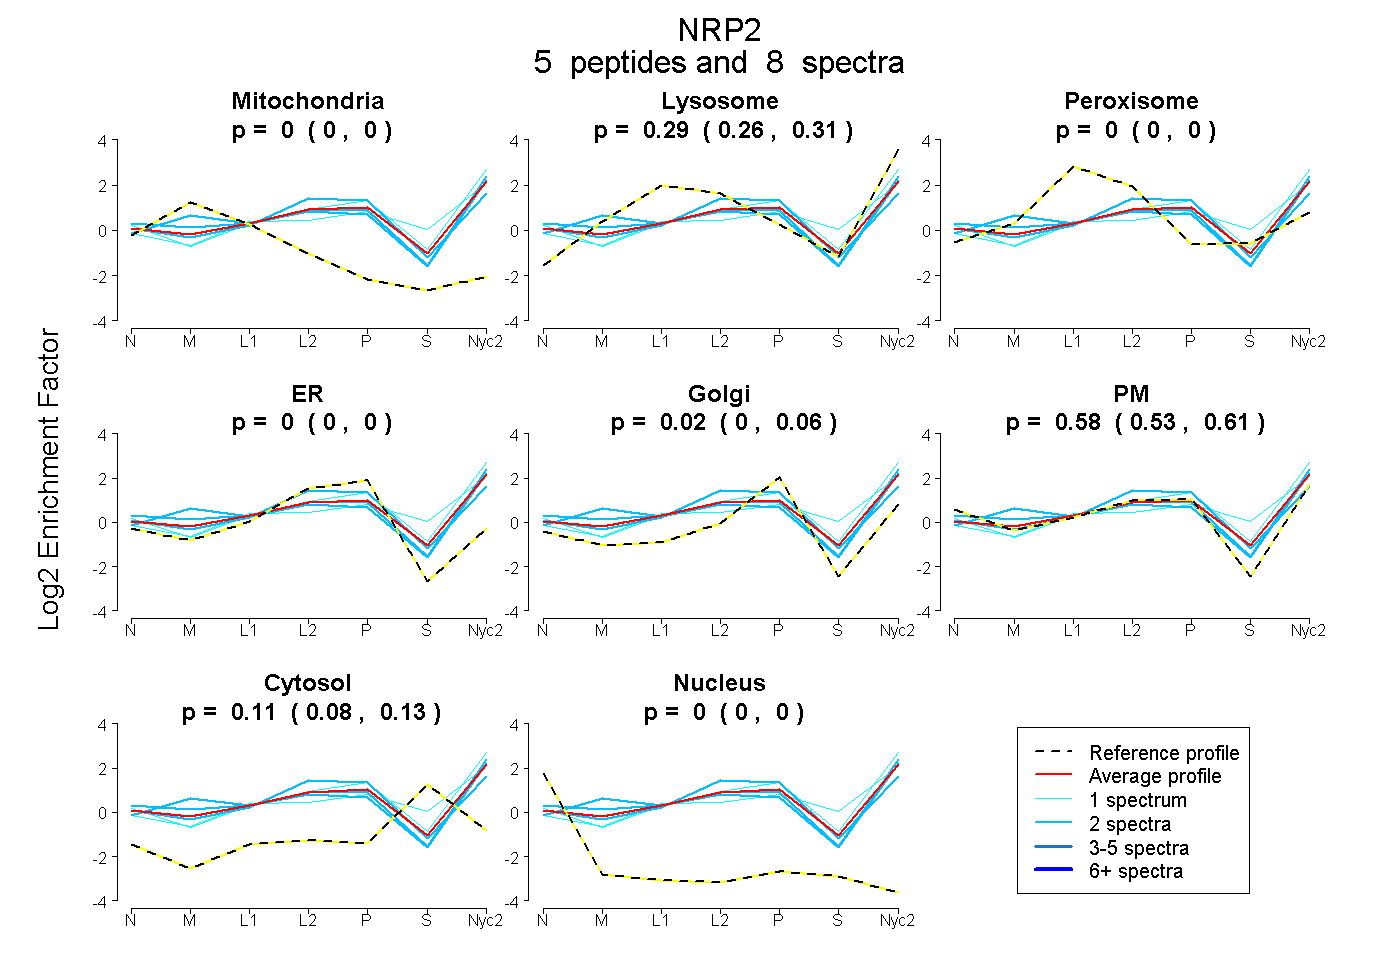
0.000 | 0.000
0.263 | 0.313
0.000 | 0.000
0.000 | 0.000
0.000 | 0.065
0.532 | 0.615
0.080 | 0.128
0.000 | 0.000
1peptide
spectrum
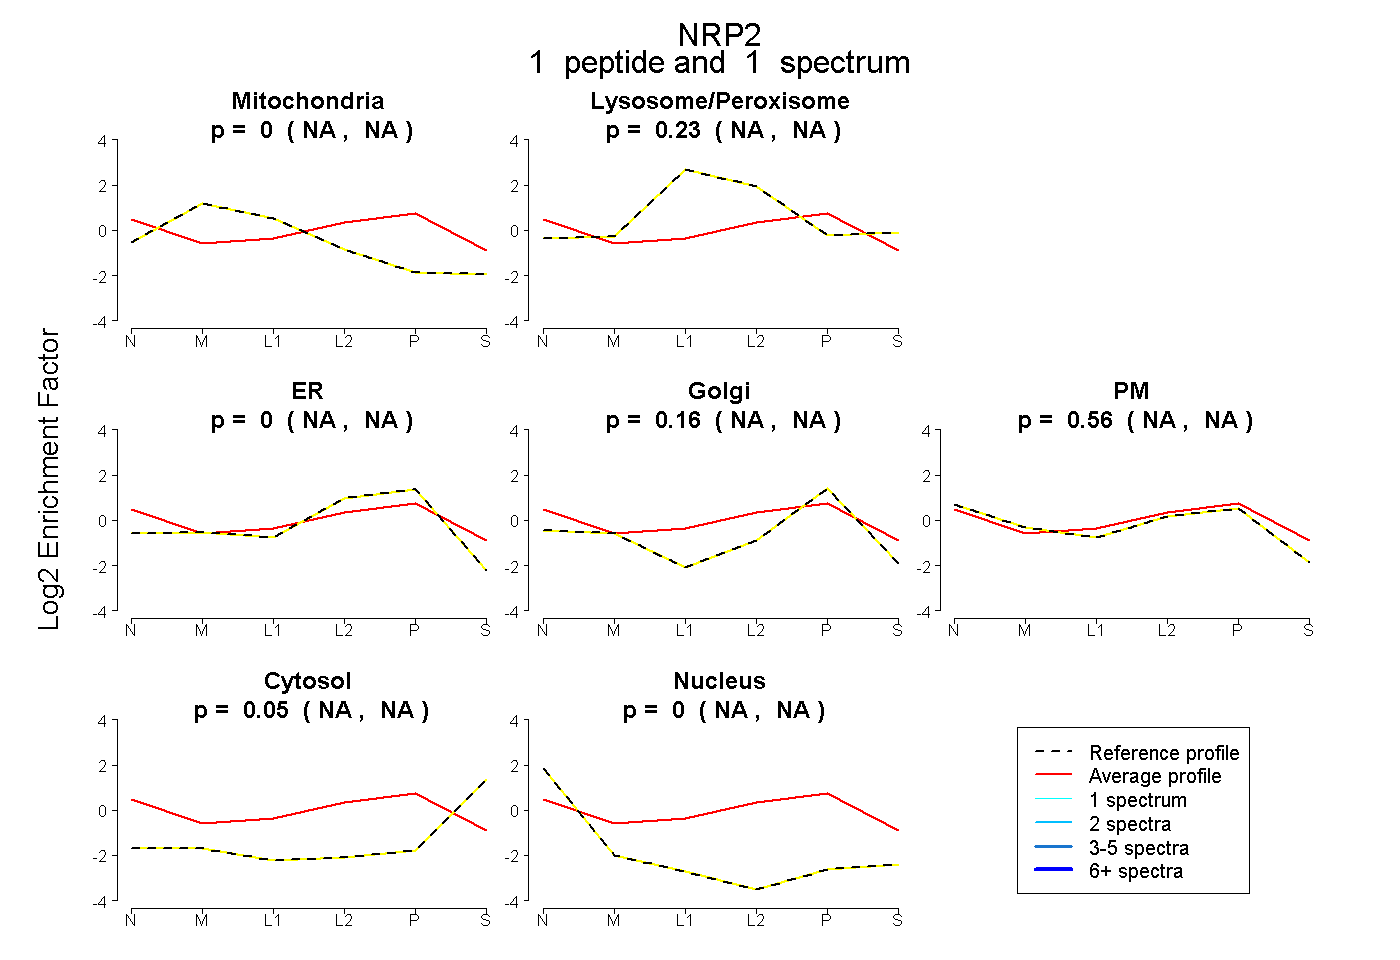
NA | NA
NA | NA
NA | NA
NA | NA
NA | NA
NA | NA
NA | NA
2peptides
spectra
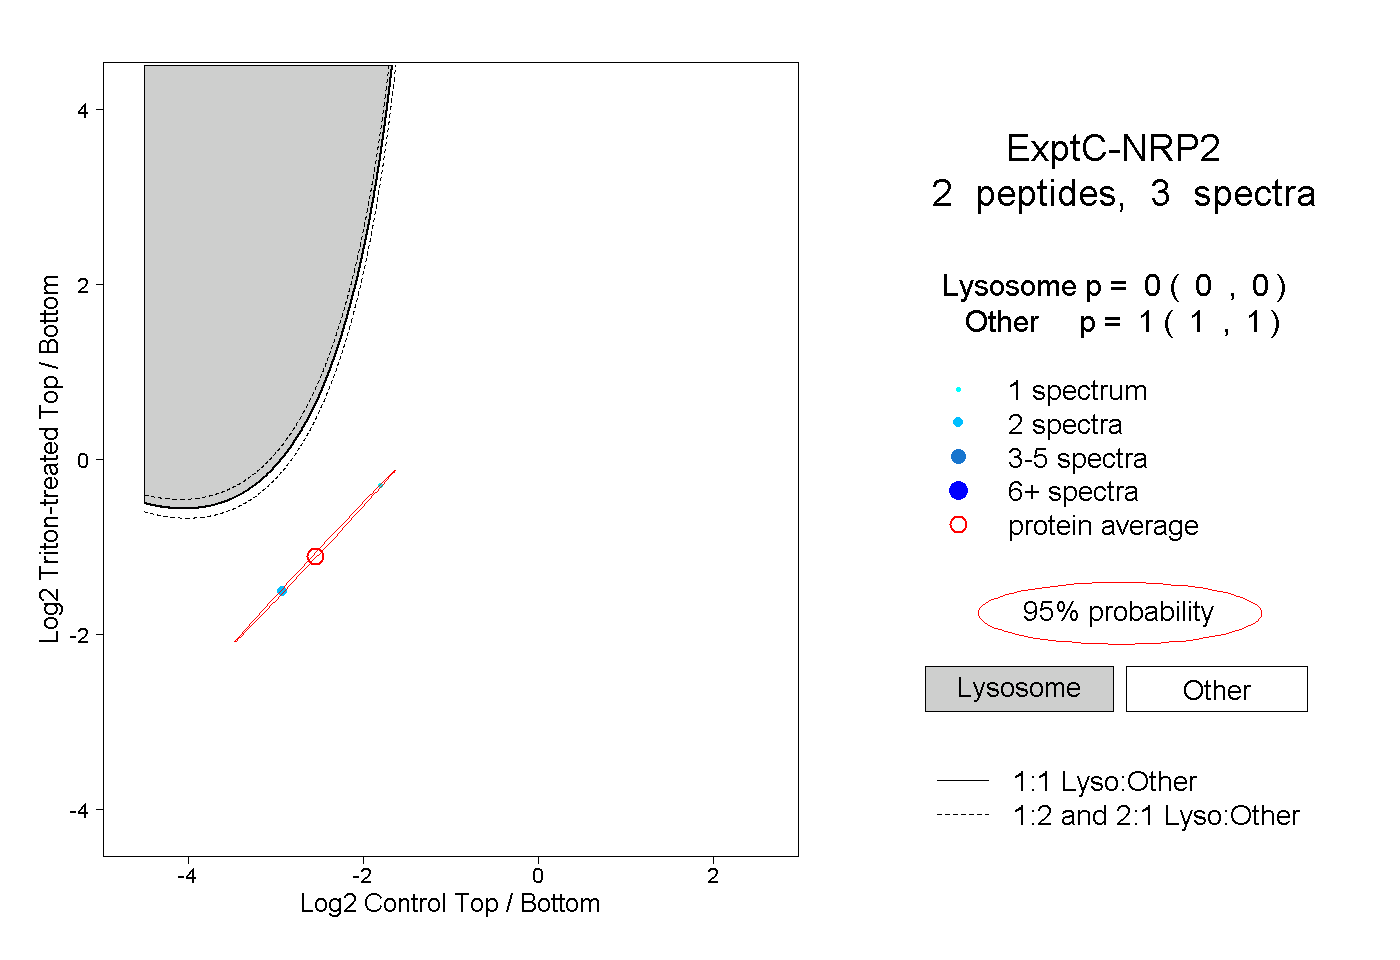
0.000 | 0.000
1.000 | 1.000