 5
5peptides
spectra
0.000 | 0.000
0.263 | 0.313
0.000 | 0.000
0.000 | 0.000
0.000 | 0.065
0.532 | 0.615
0.080 | 0.128
0.000 | 0.000
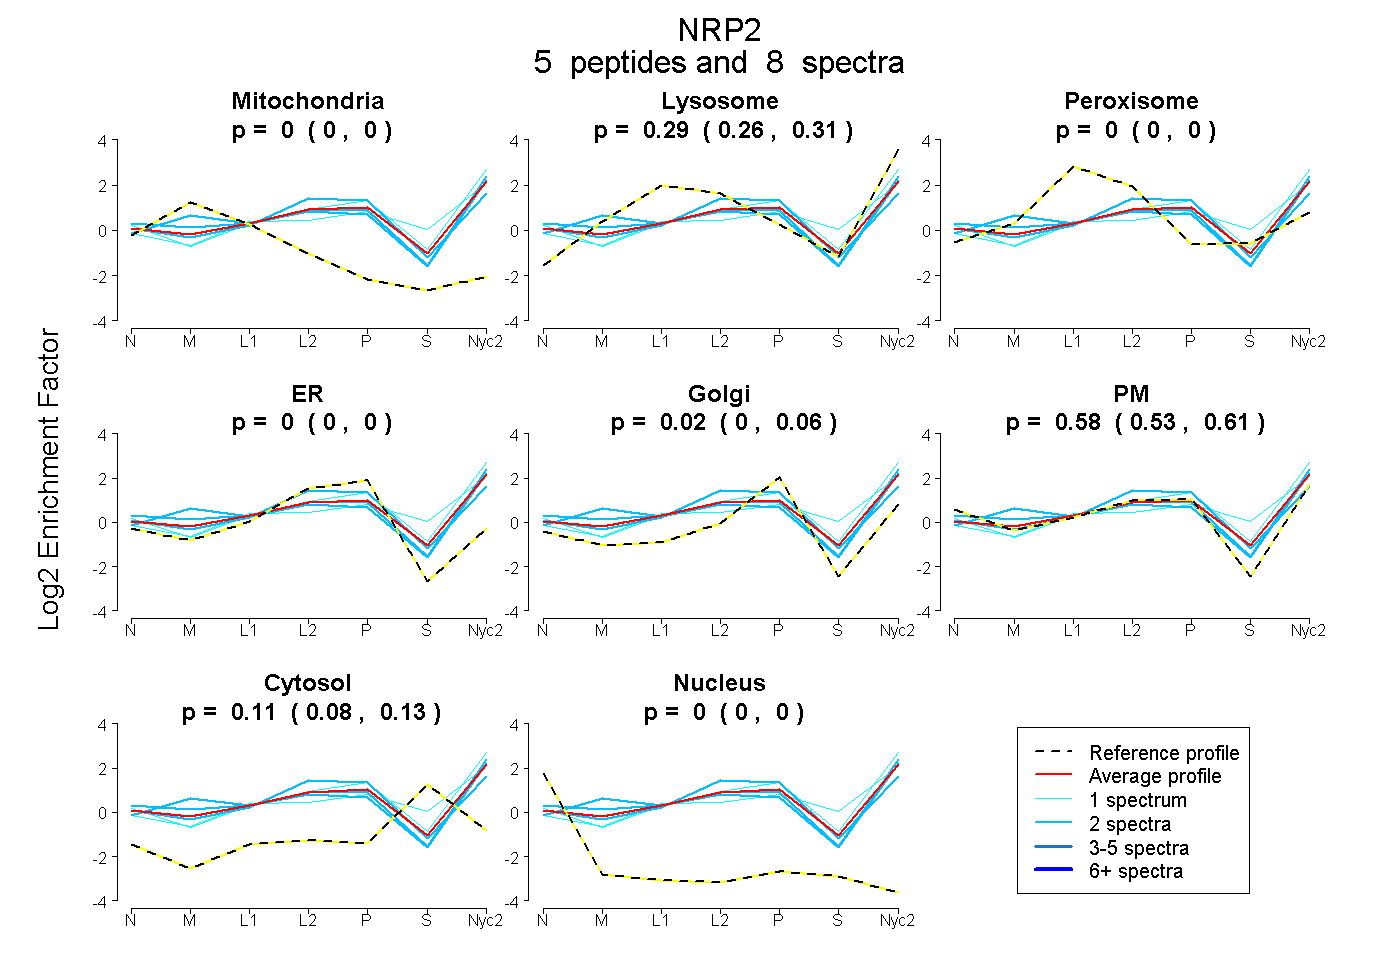
| Plot | Mito | Lyso | Perox | ER | Golgi | PM | Cytosol | Nucleus | |||||
| Expt A |
5 peptides |
8 spectra |
|
0.000 0.000 | 0.000 |
0.289 0.263 | 0.313 |
0.000 0.000 | 0.000 |
0.000 0.000 | 0.000 |
0.022 0.000 | 0.065 |
0.582 0.532 | 0.615 |
0.107 0.080 | 0.128 |
0.000 0.000 | 0.000 |
| 2 spectra, LHTPLLTR | 0.000 | 0.226 | 0.000 | 0.193 | 0.000 | 0.506 | 0.076 | 0.000 | ||
| 2 spectra, SGEISIDDIR | 0.000 | 0.250 | 0.000 | 0.000 | 0.000 | 0.714 | 0.036 | 0.000 | ||
| 1 spectrum, GGDSITAMEAR | 0.000 | 0.373 | 0.000 | 0.000 | 0.000 | 0.351 | 0.276 | 0.000 | ||
| 1 spectrum, DGDSESADLLGK | 0.000 | 0.329 | 0.000 | 0.000 | 0.087 | 0.507 | 0.078 | 0.000 | ||
| 2 spectra, LISPPVHLPR | 0.081 | 0.361 | 0.000 | 0.000 | 0.075 | 0.480 | 0.003 | 0.000 |
| Plot | Mito | Lyso or Perox | ER | Golgi | PM | Cytosol | Nucleus | ||||||
| Expt B |
1 peptide |
1 spectrum |
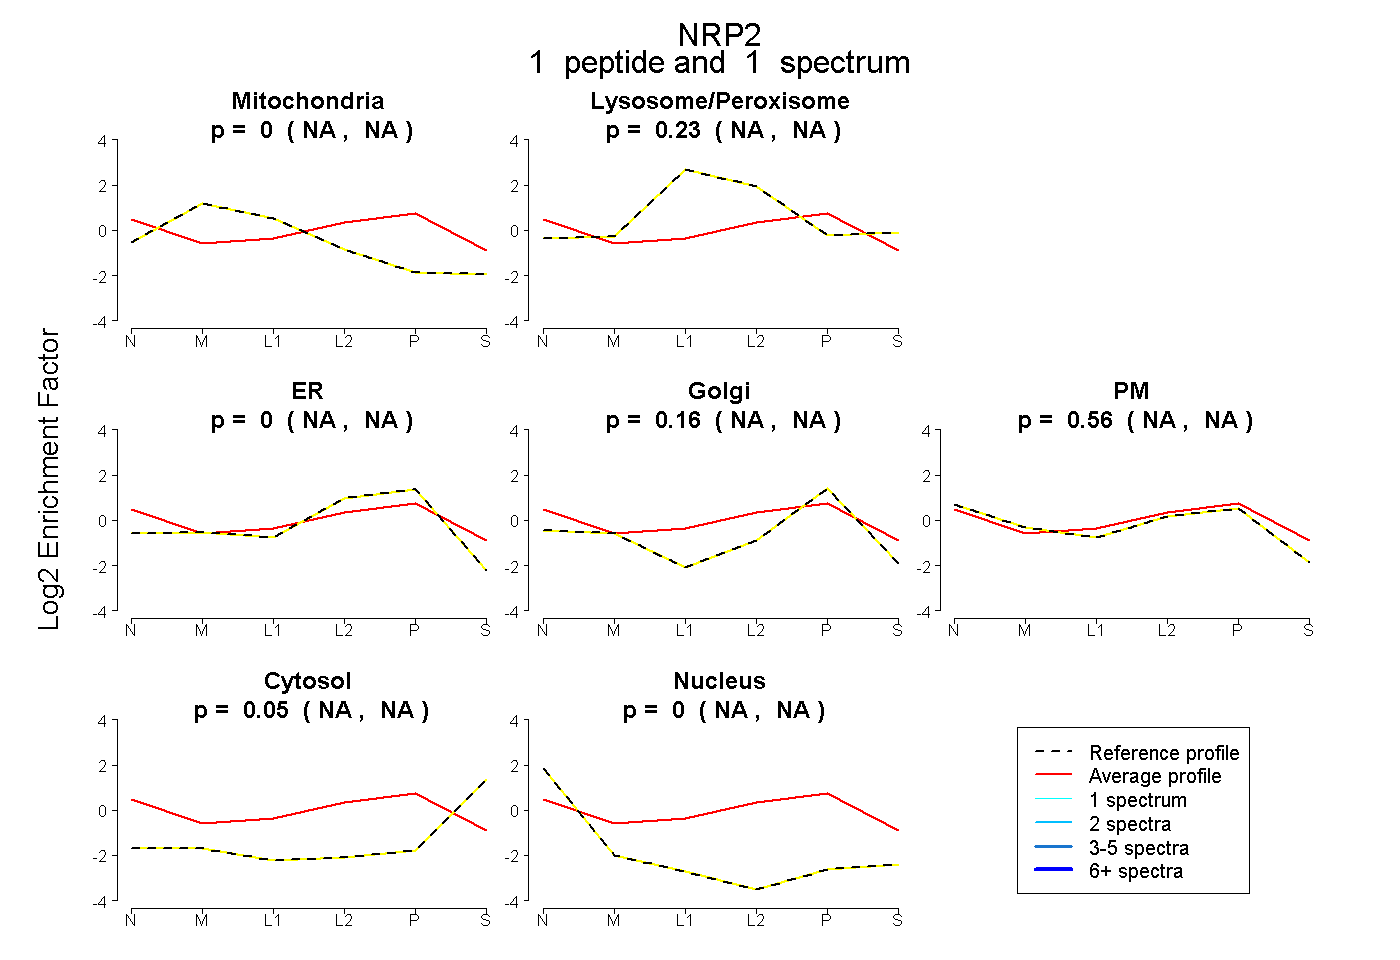 |
0.000 NA | NA |
0.228 NA | NA |
0.000 NA | NA |
0.162 NA | NA |
0.561 NA | NA |
0.048 NA | NA |
0.000 NA | NA |
|||
| Plot | Lyso | Other | |||||||||||
| Expt C |
2 peptides |
3 spectra |
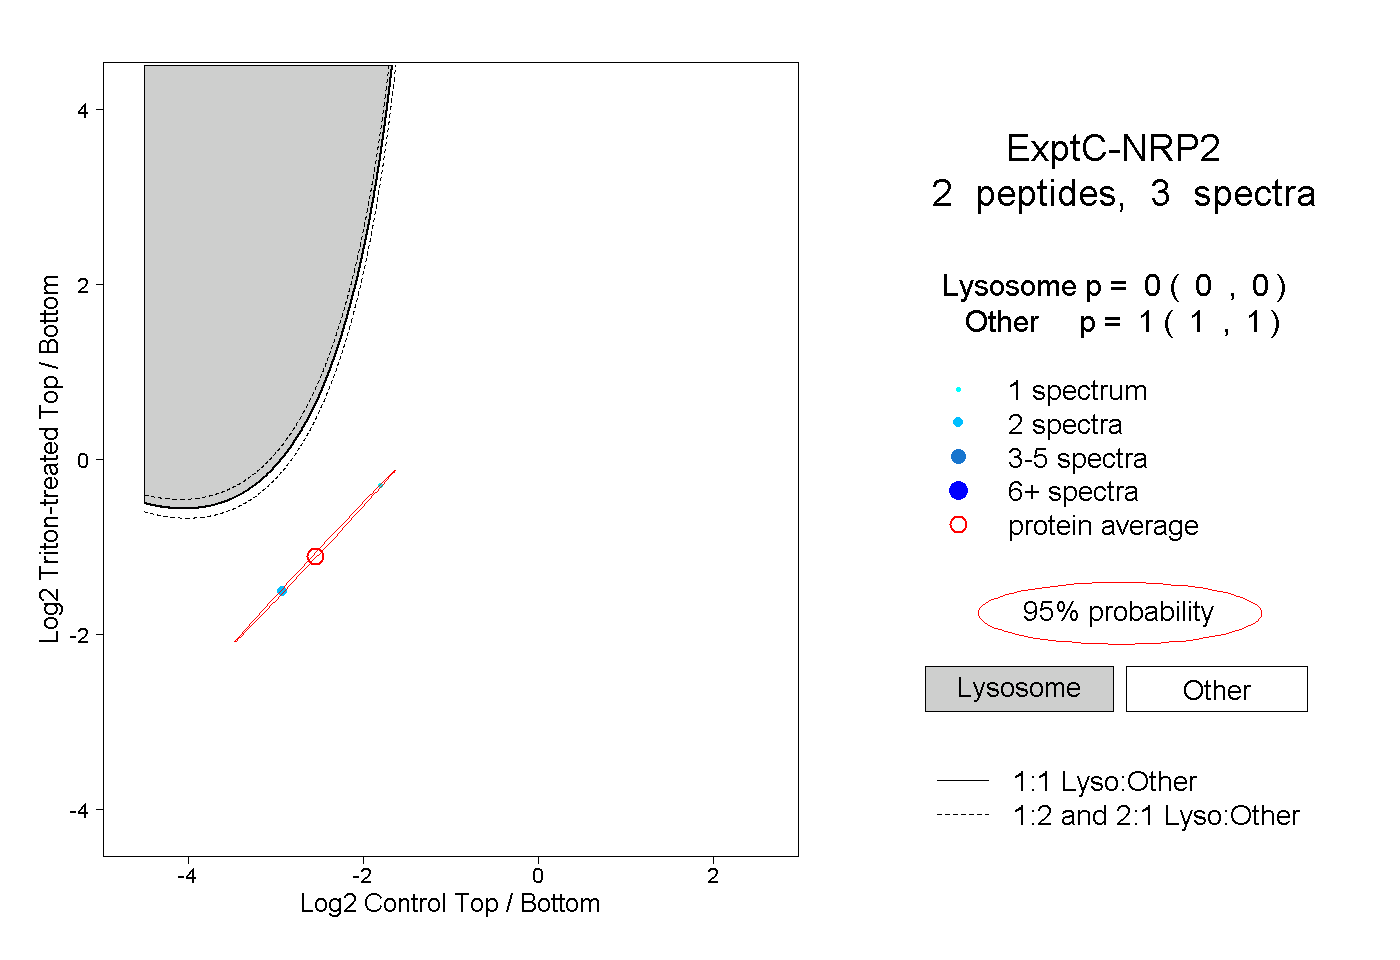 |
0.000 0.000 | 0.000 |
1.000 1.000 | 1.000 |