 8
8peptides
spectra
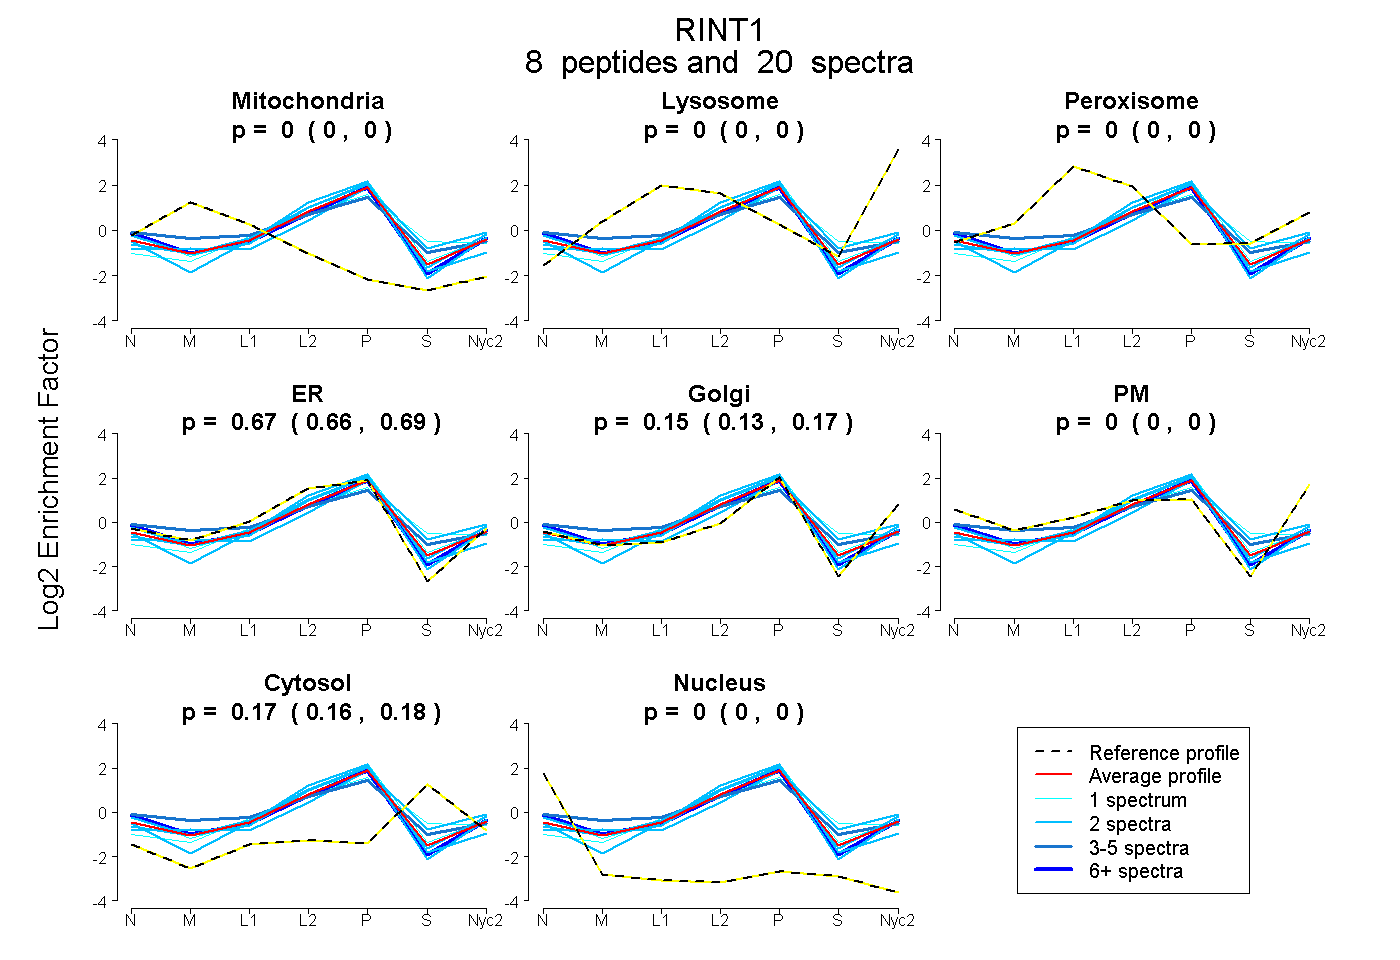
0.000 | 0.000
0.000 | 0.000
0.000 | 0.000
0.656 | 0.687
0.135 | 0.172
0.000 | 0.000
0.160 | 0.182
0.000 | 0.000
4peptides
spectra
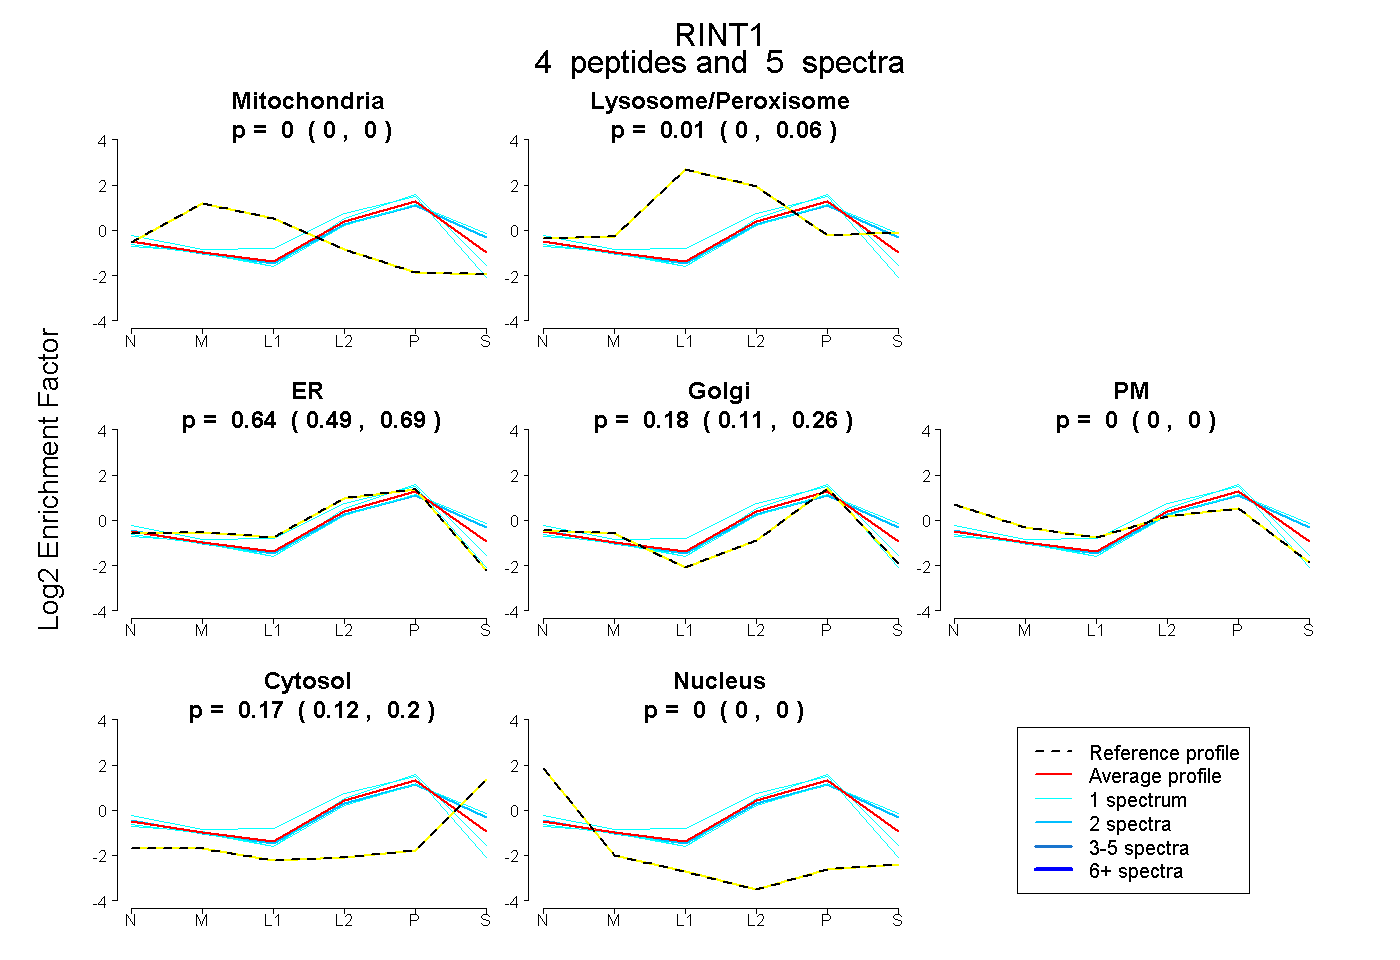
0.000 | 0.000
0.000 | 0.065
0.489 | 0.694
0.109 | 0.262
0.000 | 0.000
0.119 | 0.204
0.000 | 0.000
5peptides
spectra
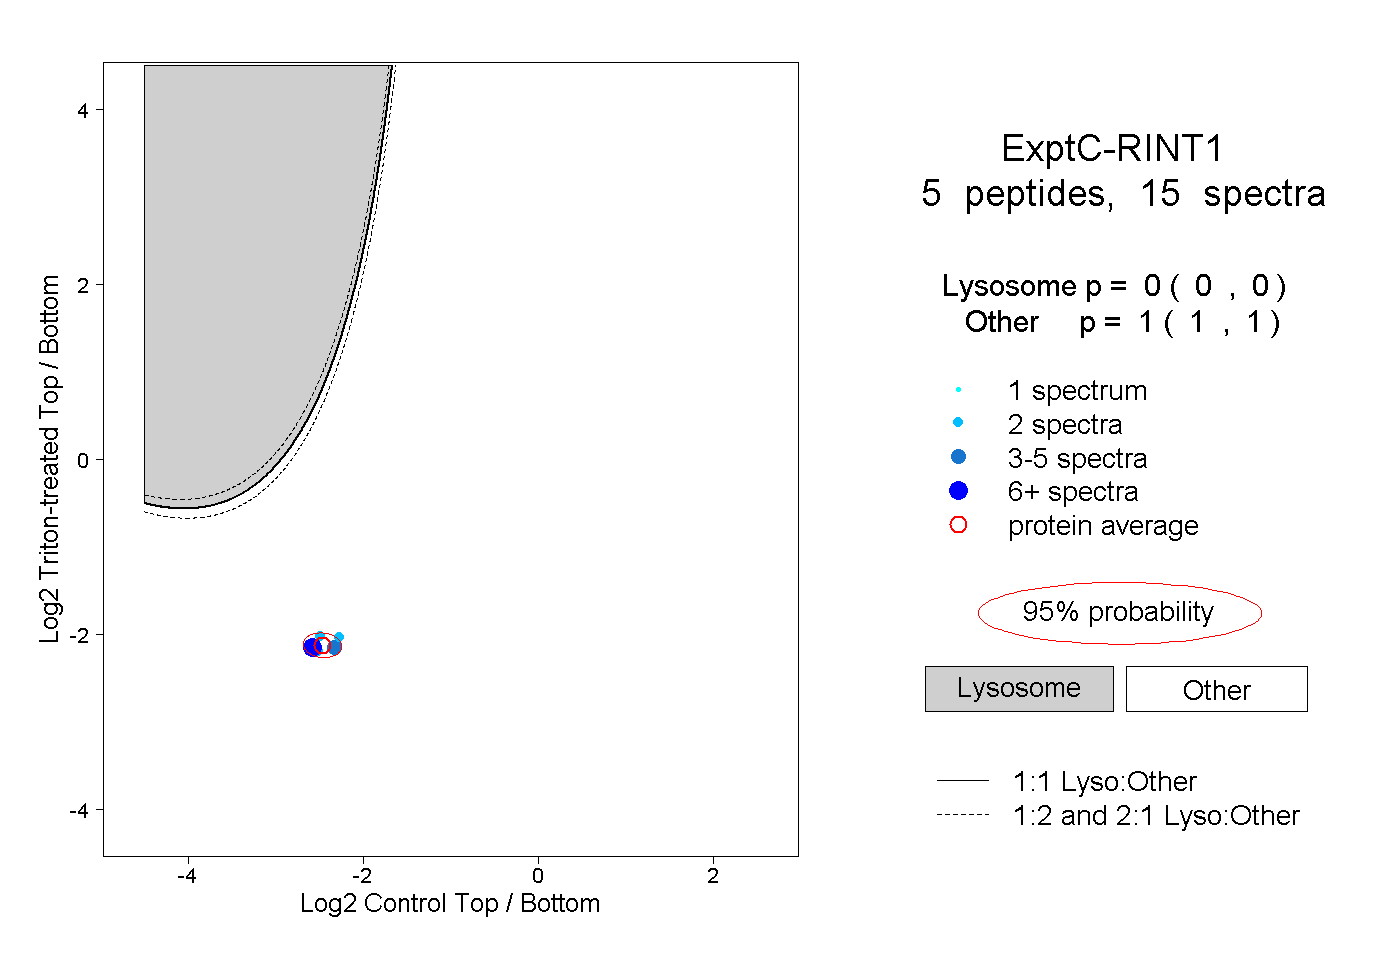
0.000 | 0.000
1.000 | 1.000
3peptides
spectra
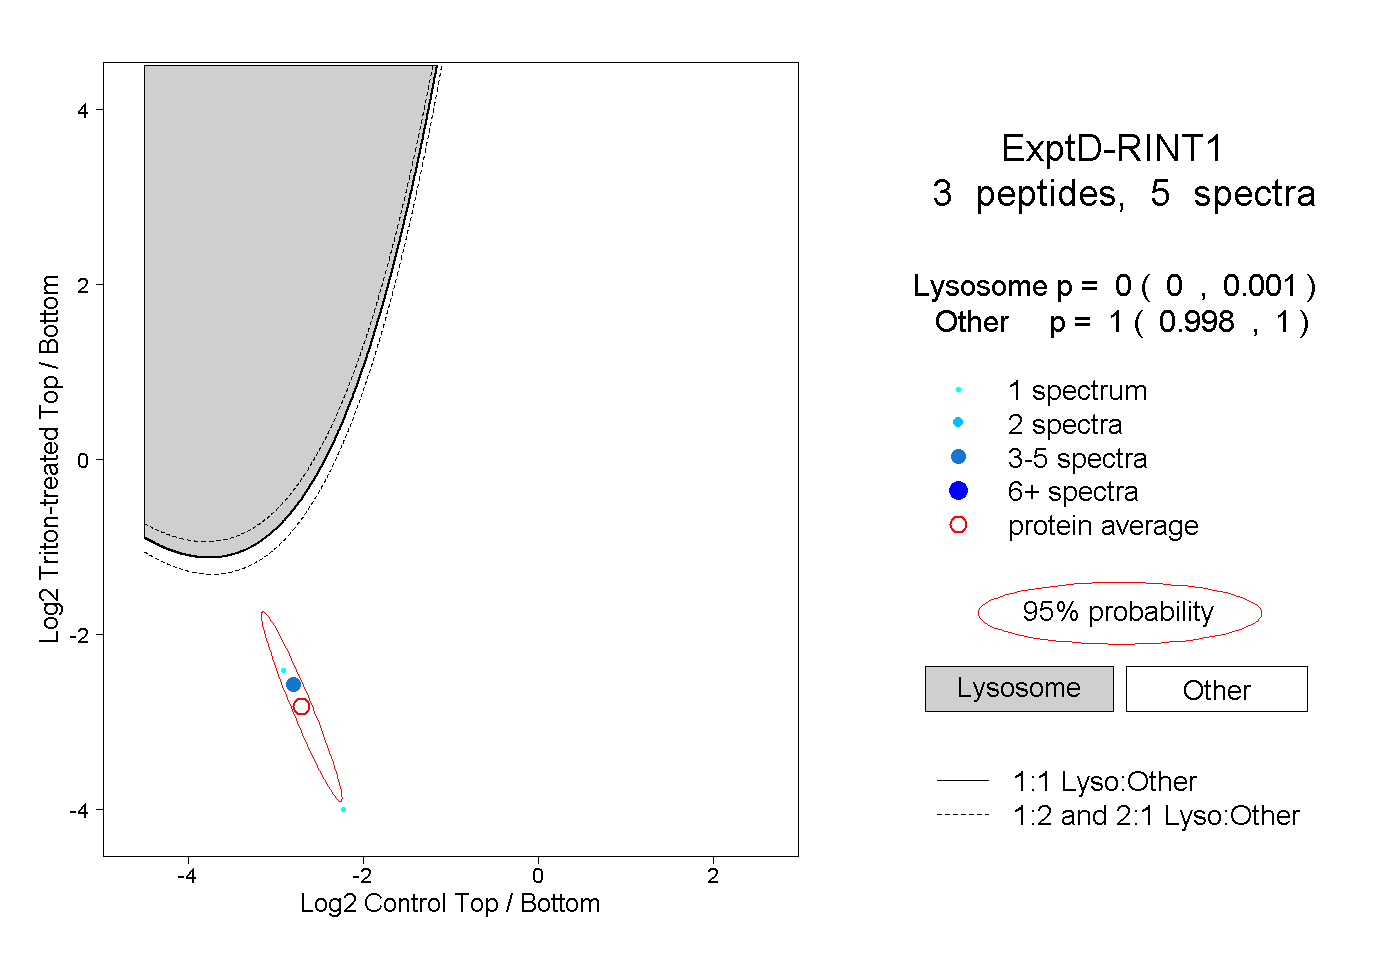
0.000 | 0.001
0.998 | 1.000