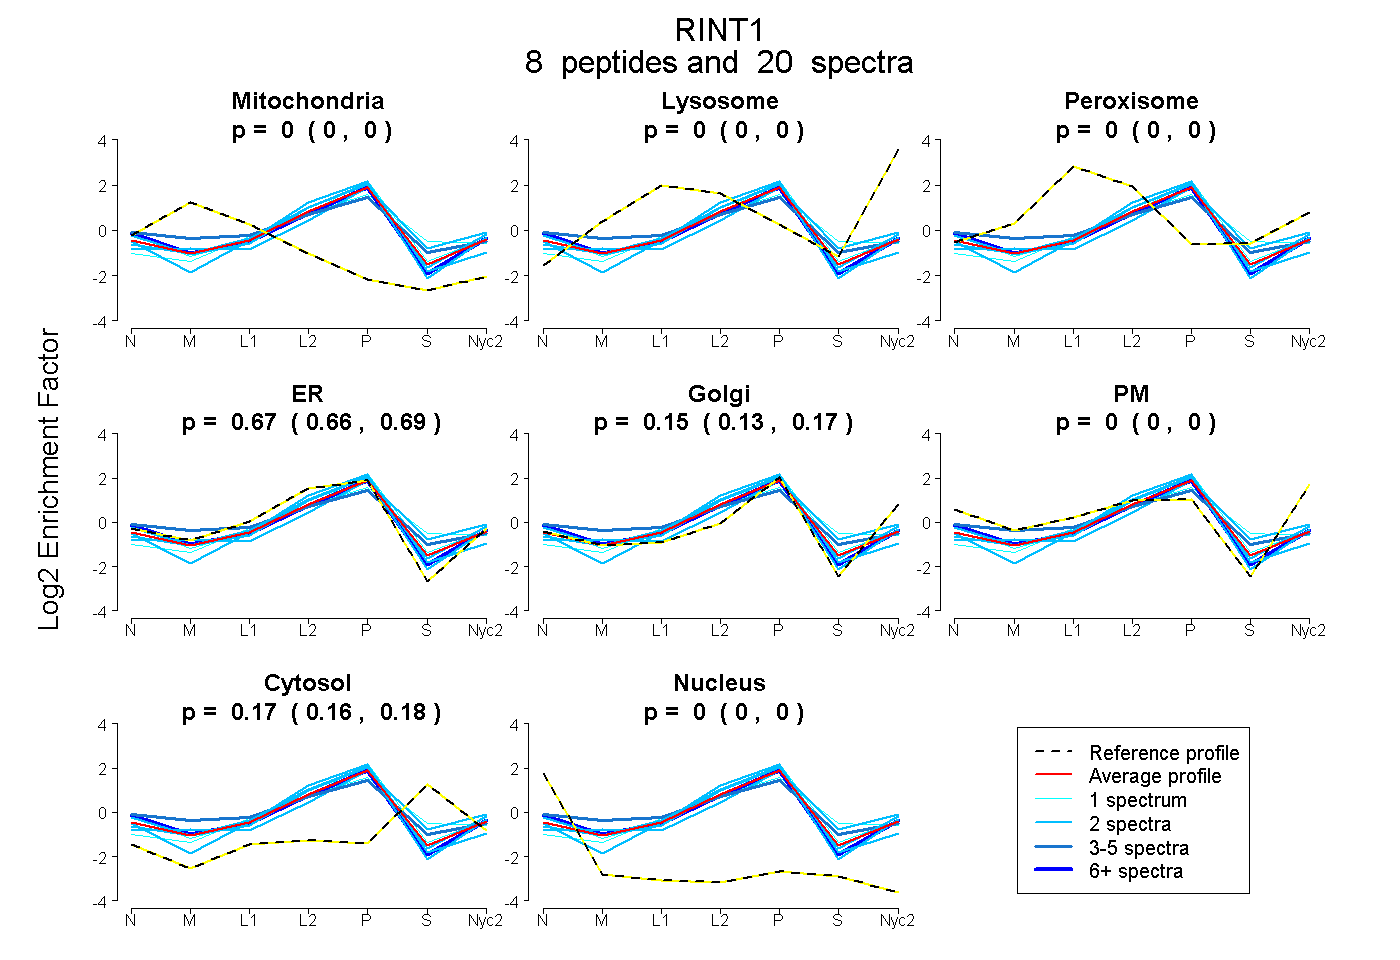
 8
8peptides
spectra
0.000 | 0.000
0.000 | 0.000
0.000 | 0.000
0.656 | 0.687
0.135 | 0.172
0.000 | 0.000
0.160 | 0.182
0.000 | 0.000
| Plot | Mito | Lyso | Perox | ER | Golgi | PM | Cytosol | Nucleus | |||||
| Expt A |
8 peptides |
20 spectra |
|
0.000 0.000 | 0.000 |
0.000 0.000 | 0.000 |
0.000 0.000 | 0.000 |
0.674 0.656 | 0.687 |
0.154 0.135 | 0.172 |
0.000 0.000 | 0.000 |
0.172 0.160 | 0.182 |
0.000 0.000 | 0.000 |
| 2 spectra, QVDHVFR | 0.000 | 0.000 | 0.000 | 0.683 | 0.193 | 0.000 | 0.124 | 0.000 | ||
| 4 spectra, NLFPLFSHYCK | 0.025 | 0.000 | 0.088 | 0.583 | 0.107 | 0.000 | 0.197 | 0.000 | ||
| 6 spectra, DLVDDFR | 0.000 | 0.000 | 0.000 | 0.648 | 0.231 | 0.000 | 0.104 | 0.017 | ||
| 1 spectrum, APLGFR | 0.000 | 0.000 | 0.006 | 0.676 | 0.000 | 0.000 | 0.318 | 0.000 | ||
| 2 spectra, LTQVMK | 0.000 | 0.011 | 0.000 | 0.387 | 0.358 | 0.000 | 0.244 | 0.000 | ||
| 1 spectrum, DITDVDEMK | 0.000 | 0.000 | 0.000 | 0.628 | 0.192 | 0.000 | 0.179 | 0.000 | ||
| 2 spectra, GLVMLILEK | 0.000 | 0.000 | 0.000 | 0.841 | 0.000 | 0.000 | 0.157 | 0.002 | ||
| 2 spectra, TNWPNPGK | 0.000 | 0.000 | 0.000 | 0.681 | 0.247 | 0.000 | 0.058 | 0.014 |
| Plot | Mito | Lyso or Perox | ER | Golgi | PM | Cytosol | Nucleus | ||||||
| Expt B |
4 peptides |
5 spectra |
 |
0.000 0.000 | 0.000 |
0.014 0.000 | 0.065 |
0.640 0.489 | 0.694 |
0.176 0.109 | 0.262 |
0.000 0.000 | 0.000 |
0.170 0.119 | 0.204 |
0.000 0.000 | 0.000 |
|||
| Plot | Lyso | Other | |||||||||||
| Expt C |
5 peptides |
15 spectra |
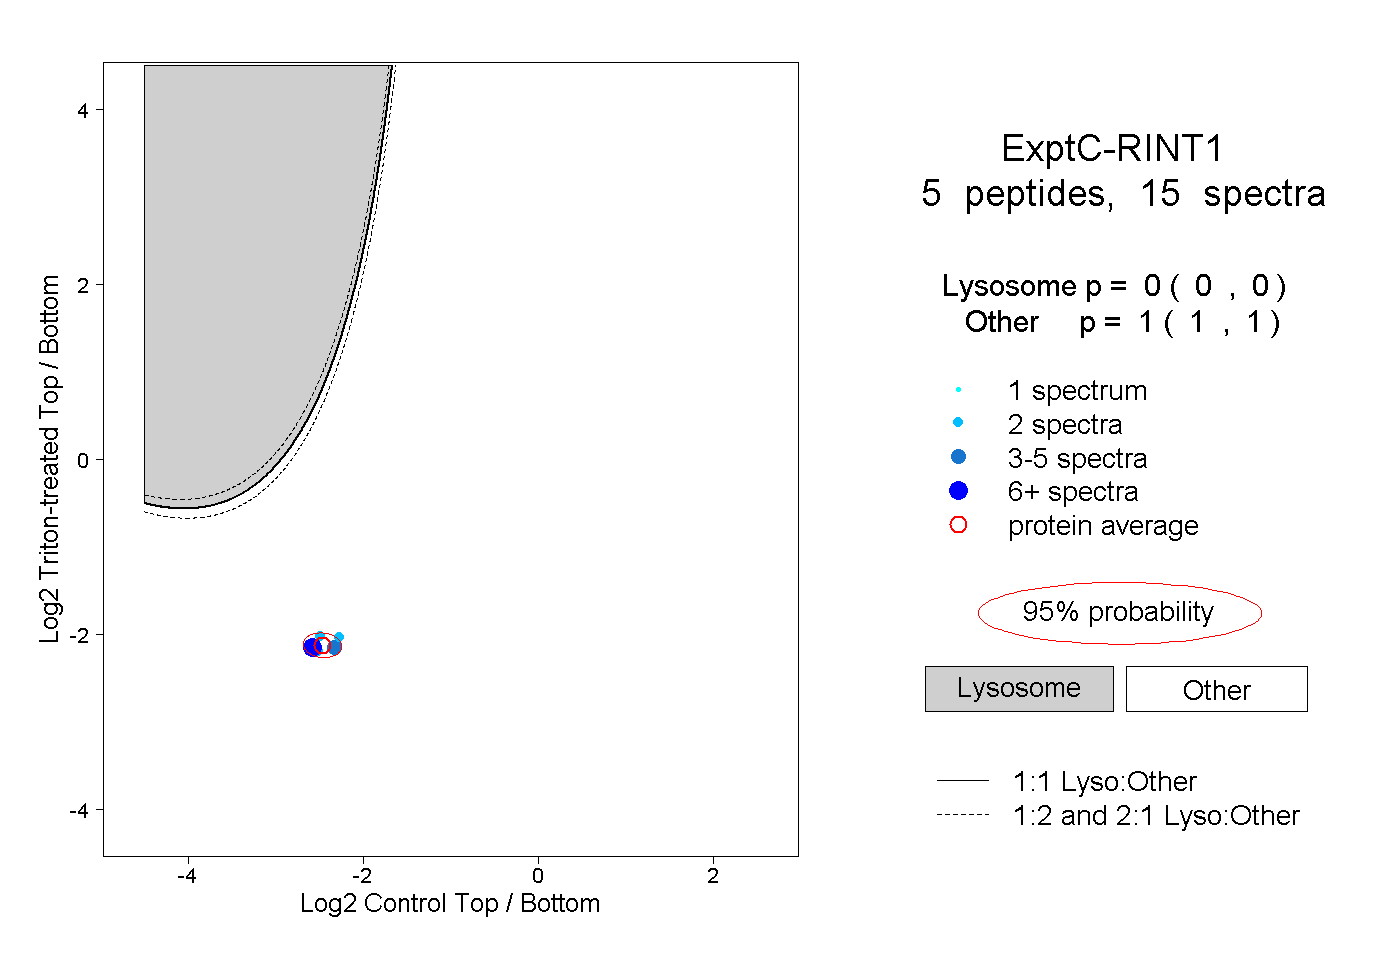 |
0.000 0.000 | 0.000 |
1.000 1.000 | 1.000 |
||||||||
| Plot | Lyso | Other | |||||||||||
| Expt D |
3 peptides |
5 spectra |
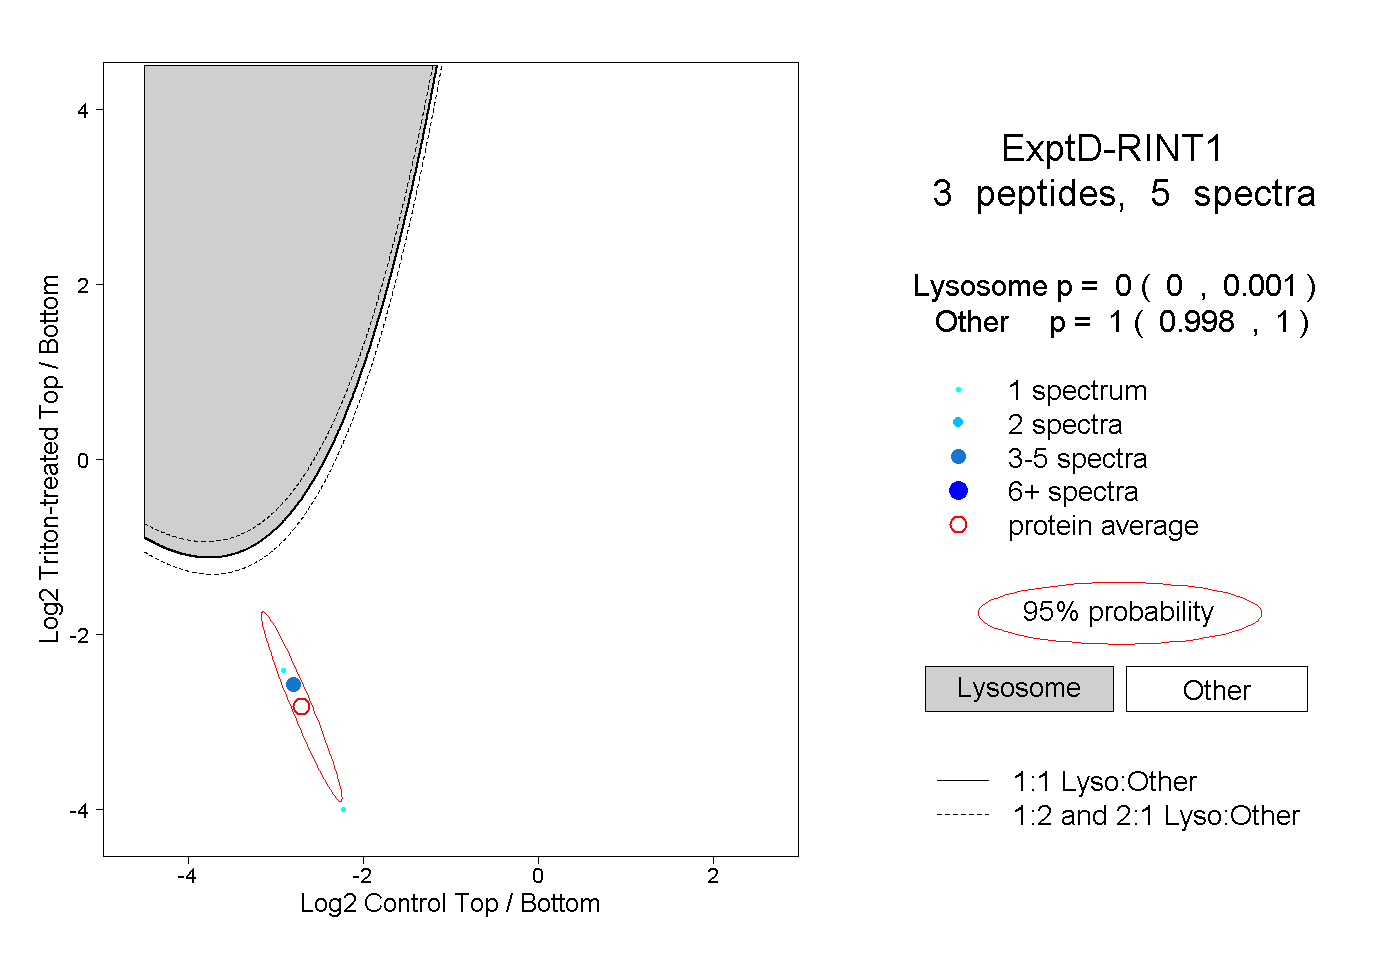 |
0.000 0.000 | 0.001 |
1.000 0.998 | 1.000 |