 6
6peptides
spectra
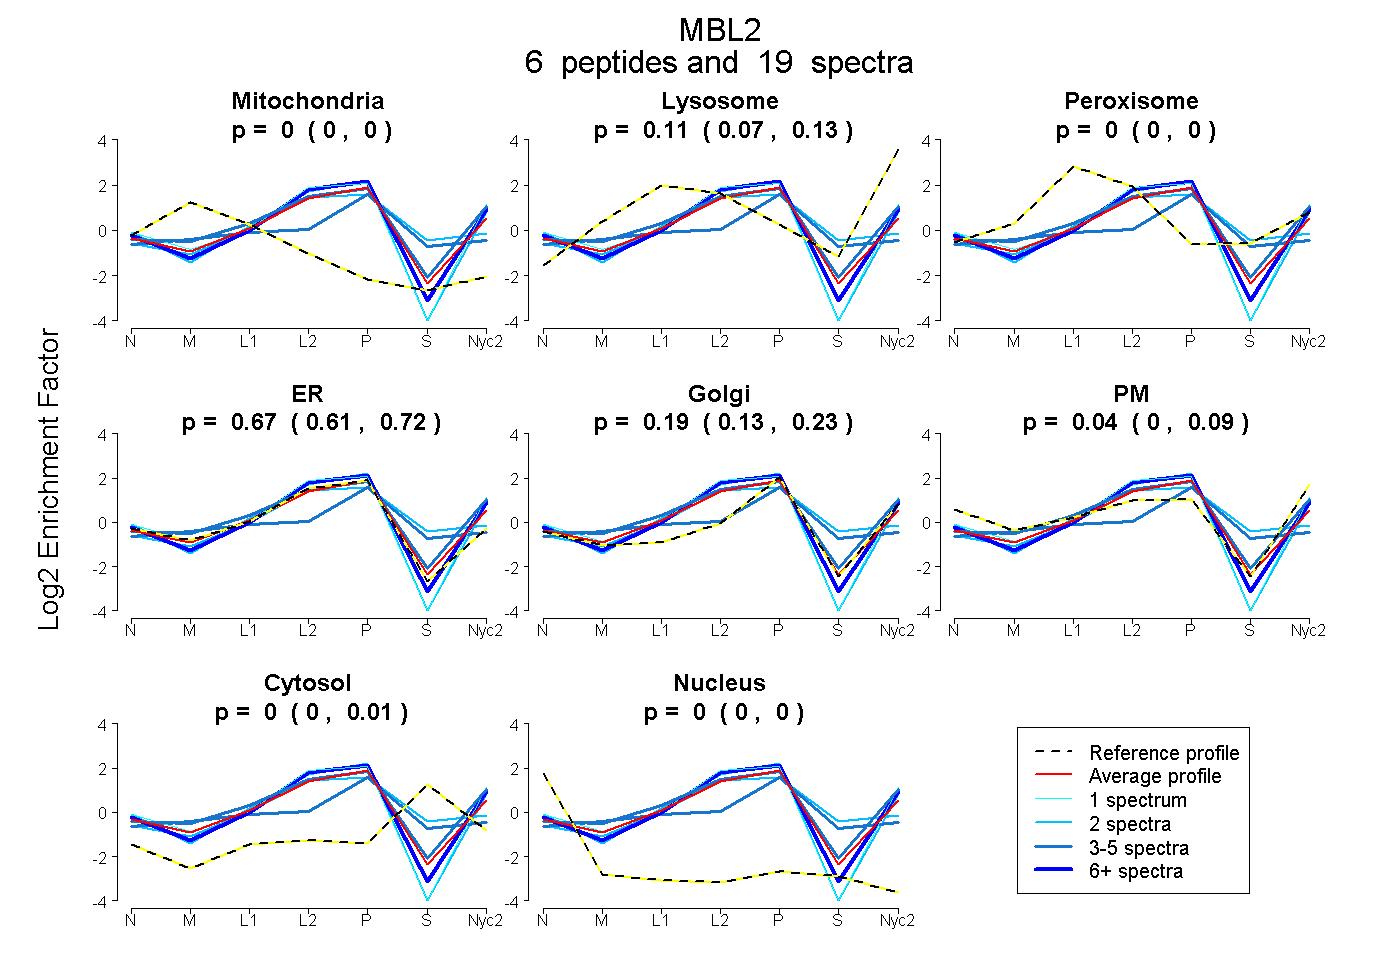
0.000 | 0.000
0.070 | 0.131
0.000 | 0.000
0.610 | 0.717
0.127 | 0.228
0.000 | 0.090
0.000 | 0.011
0.000 | 0.000
4peptides
spectra
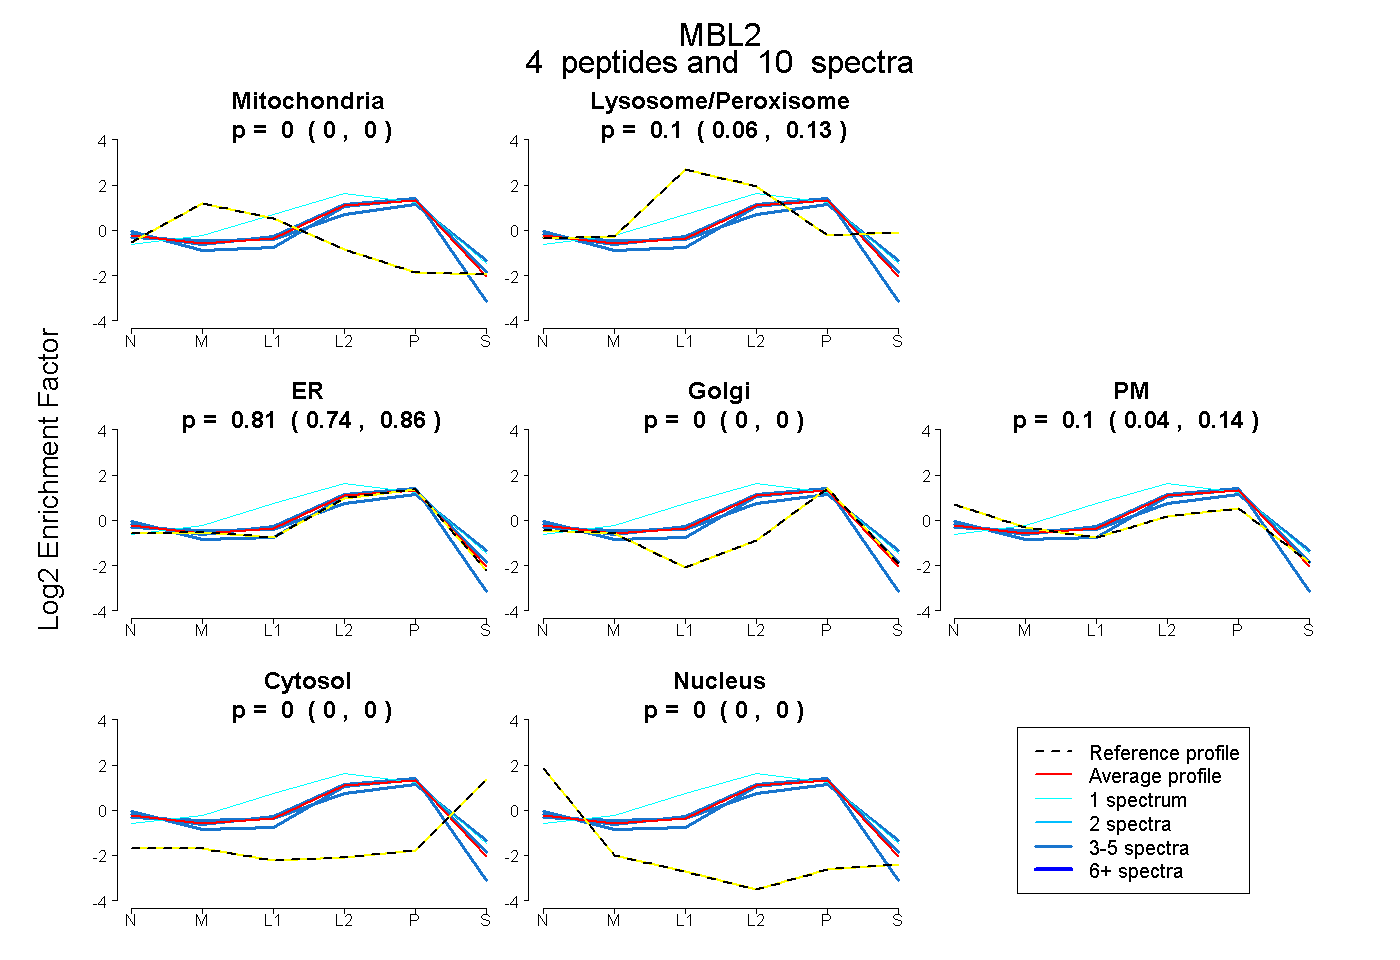
0.000 | 0.000
0.062 | 0.129
0.745 | 0.857
0.000 | 0.000
0.042 | 0.137
0.000 | 0.000
0.000 | 0.000
8peptides
spectra
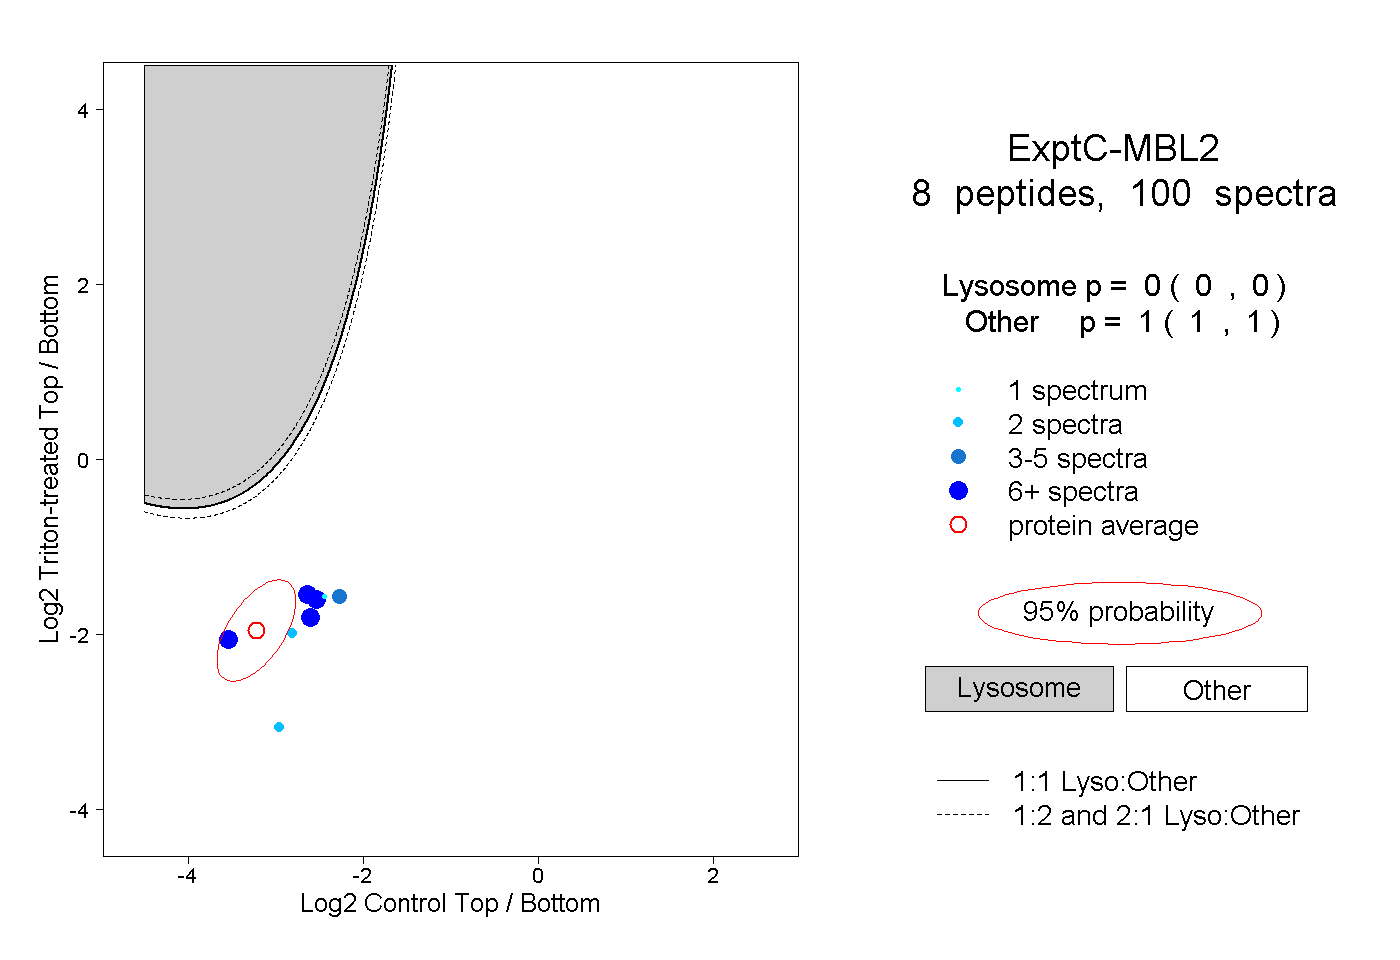
0.000 | 0.000
1.000 | 1.000
2peptides
spectra
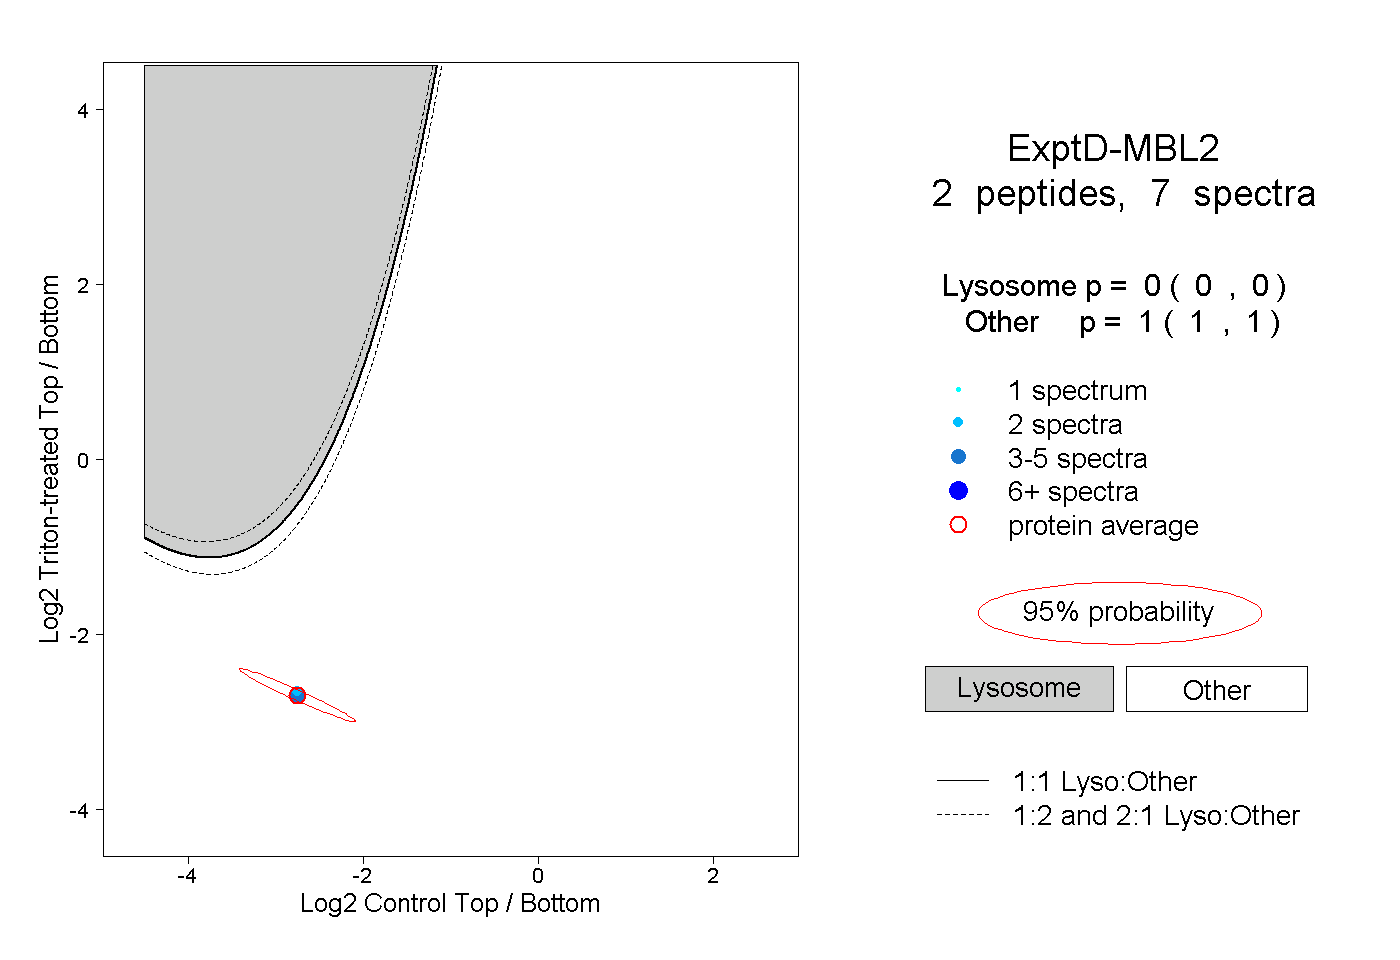
0.000 | 0.000
1.000 | 1.000