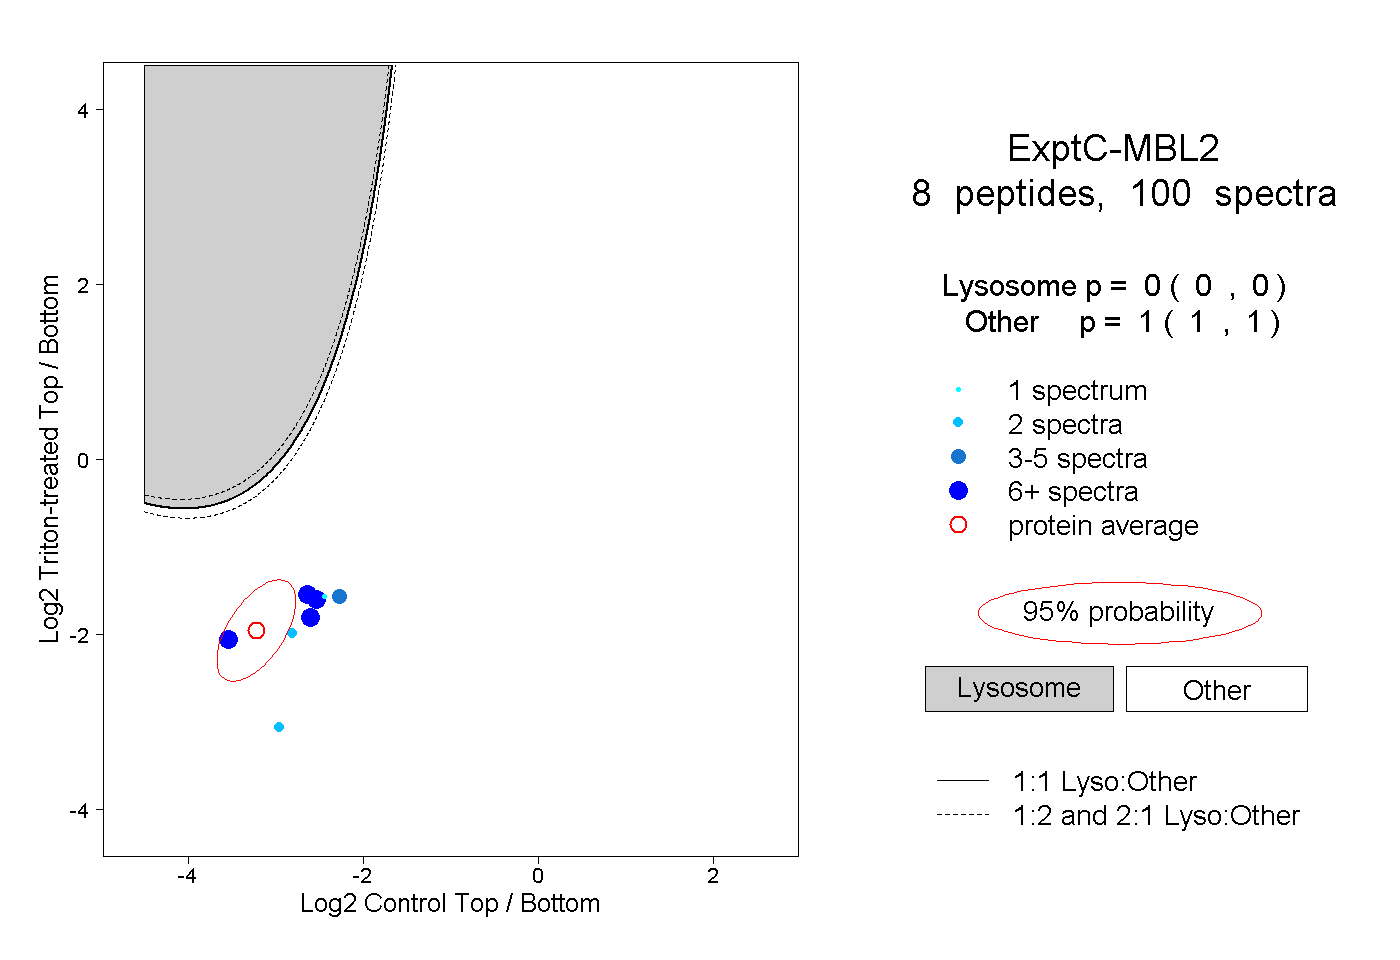
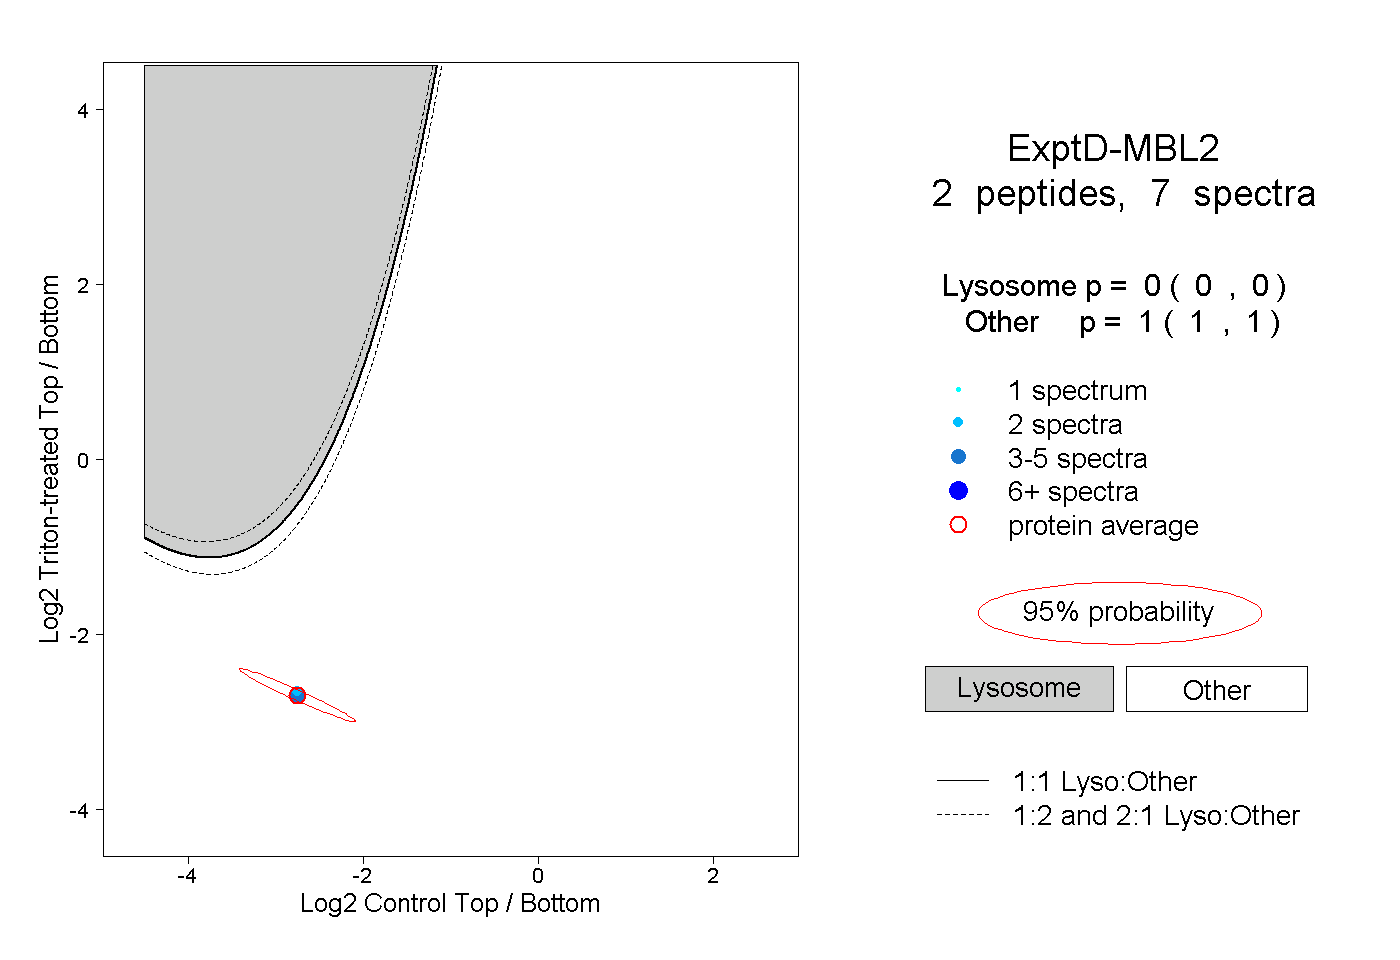
MBL2
[ENSRNOP00000047103]
Main page
| | | Plot |
Mito |
Lyso |
|
Perox |
ER |
Golgi |
PM |
Cytosol |
Nucleus |
|
| Expt A |
 6
6
peptides |
19
spectra |
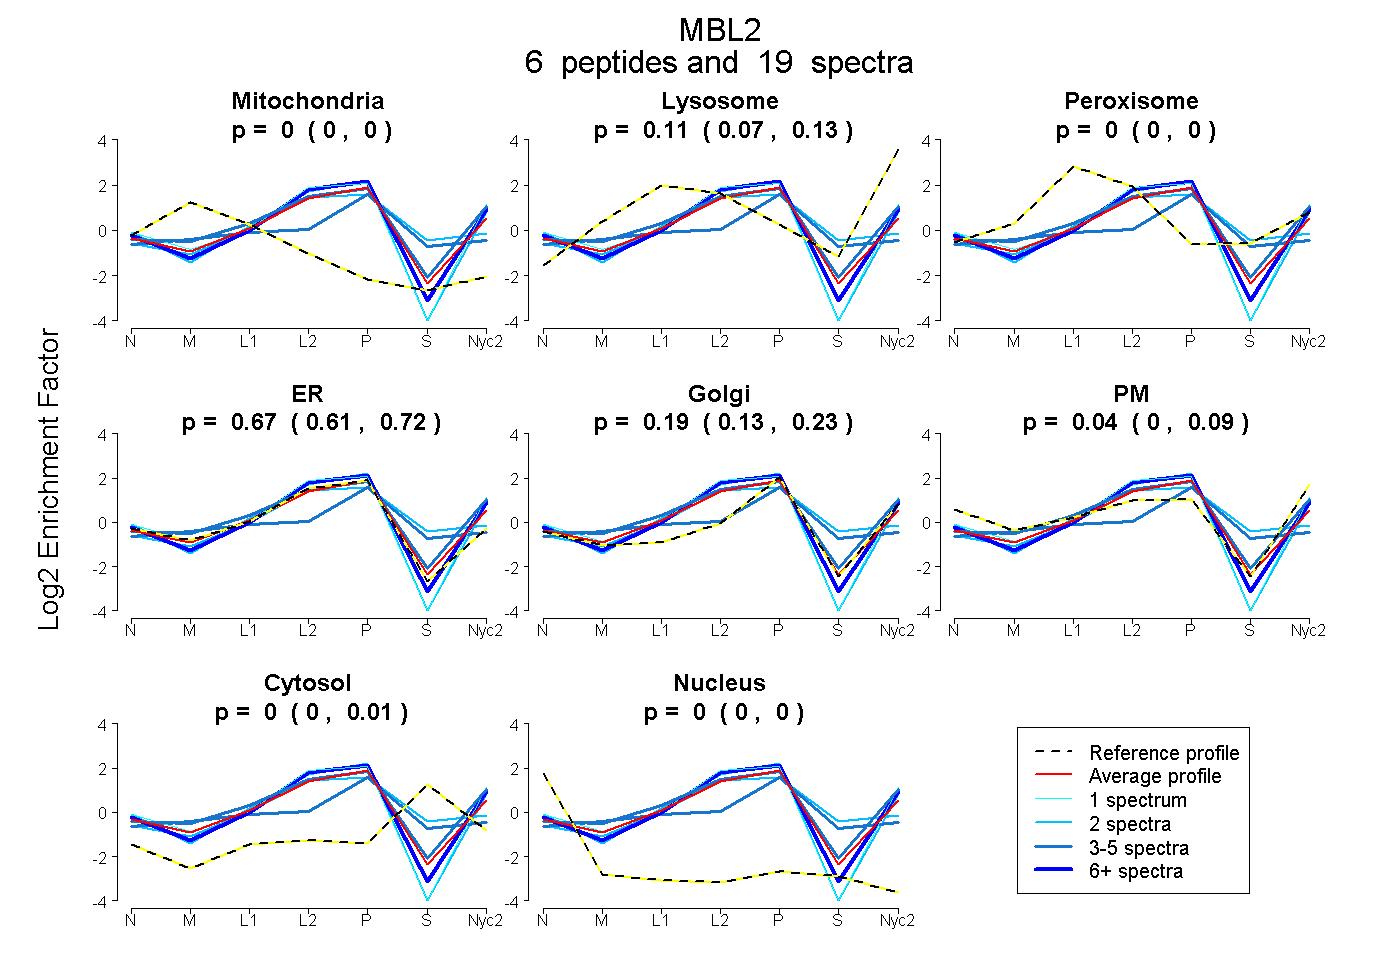 |
0.000
0.000 | 0.000 |
0.105
0.070 | 0.131 |
|
0.000
0.000 | 0.000 |
0.668
0.610 | 0.717 |
0.186
0.127 | 0.228 |
0.040
0.000 | 0.090 |
0.000
0.000 | 0.011 |
0.000
0.000 | 0.000 |
|
| | | Plot |
Mito |
|
Lyso or Perox |
|
ER |
Golgi |
PM |
Cytosol |
Nucleus |
|
| Expt B |
4
peptides |
10
spectra |
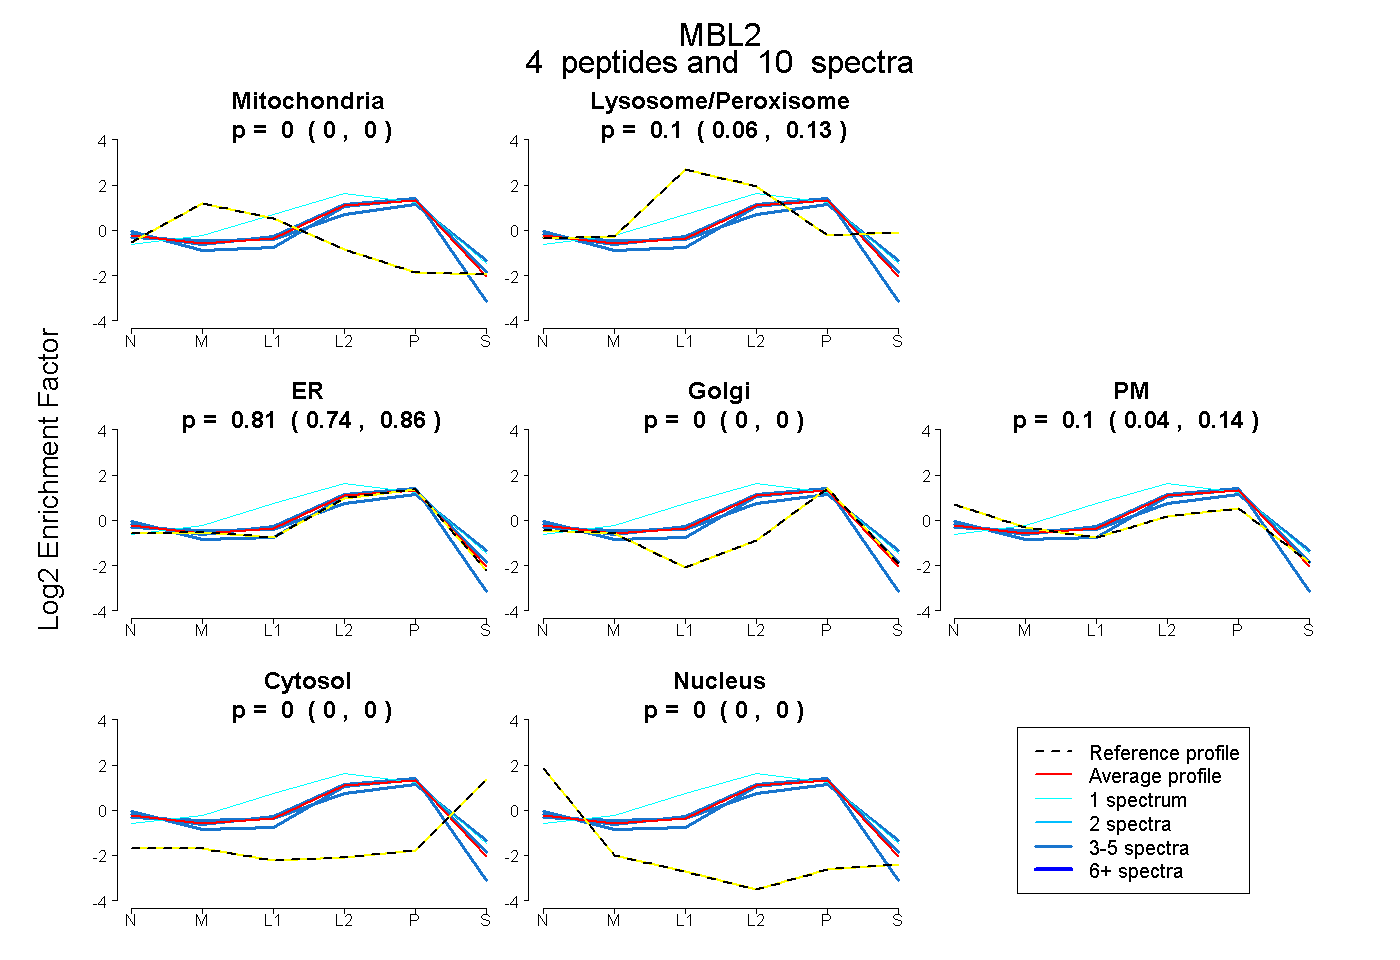 |
0.000
0.000 | 0.000 |
|
0.098
0.062 | 0.129 |
|
0.807
0.745 | 0.857 |
0.000
0.000 | 0.000 |
0.095
0.042 | 0.137 |
0.000
0.000 | 0.000 |
0.000
0.000 | 0.000 |
|
| 1 spectrum, YFMSSVR |
0.000 |
|
0.380 |
|
0.620 |
0.000 |
0.000 |
0.000 |
0.000 |
|
| 3 spectra, TENVFEDLTGNR |
0.000 |
|
0.029 |
|
0.778 |
0.000 |
0.194 |
0.000 |
0.000 |
|
| 3 spectra, DVAFLGITDQR |
0.000 |
|
0.000 |
|
1.000 |
0.000 |
0.000 |
0.000 |
0.000 |
|
| 3 spectra, AIQNVAK |
0.000 |
|
0.257 |
|
0.407 |
0.324 |
0.012 |
0.000 |
0.000 |
|
| | | Plot |
|
Lyso |
|
|
|
|
|
|
|
Other |
| Expt C |
8
peptides |
100
spectra |
 |
|
0.000
0.000 | 0.000 |
|
|
|
|
|
|
|
1.000
1.000 | 1.000 |
| | | Plot |
|
Lyso |
|
|
|
|
|
|
|
Other |
| Expt D |
2
peptides |
7
spectra |
 |
|
0.000
0.000 | 0.000 |
|
|
|
|
|
|
|
1.000
1.000 | 1.000 |