 5
5peptides
spectra
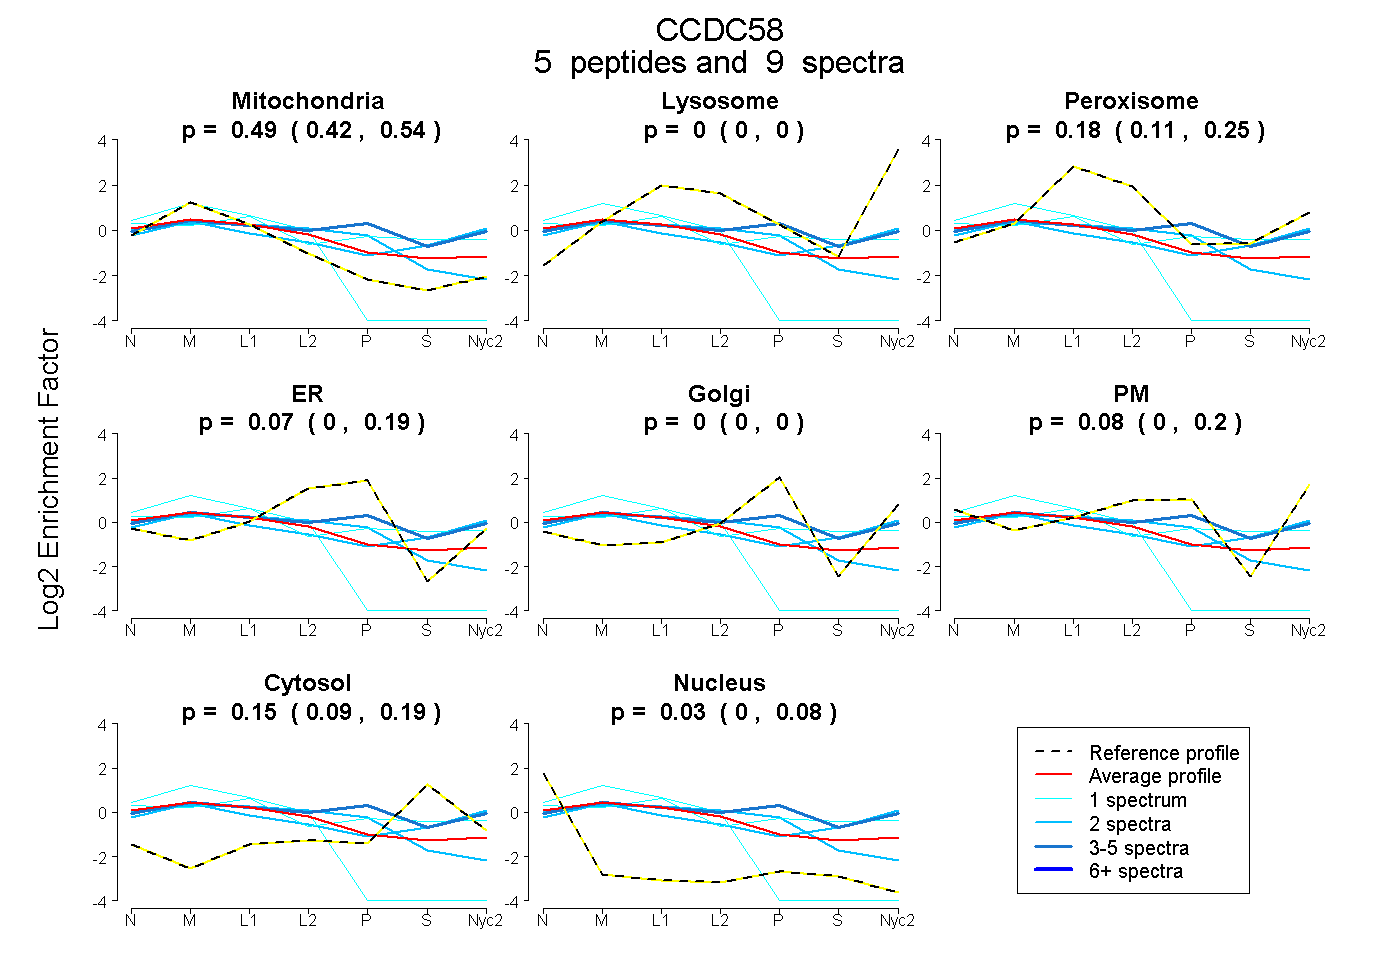
0.425 | 0.535
0.000 | 0.000
0.112 | 0.252
0.000 | 0.188
0.000 | 0.000
0.000 | 0.200
0.093 | 0.191
0.000 | 0.076
1peptide
spectrum
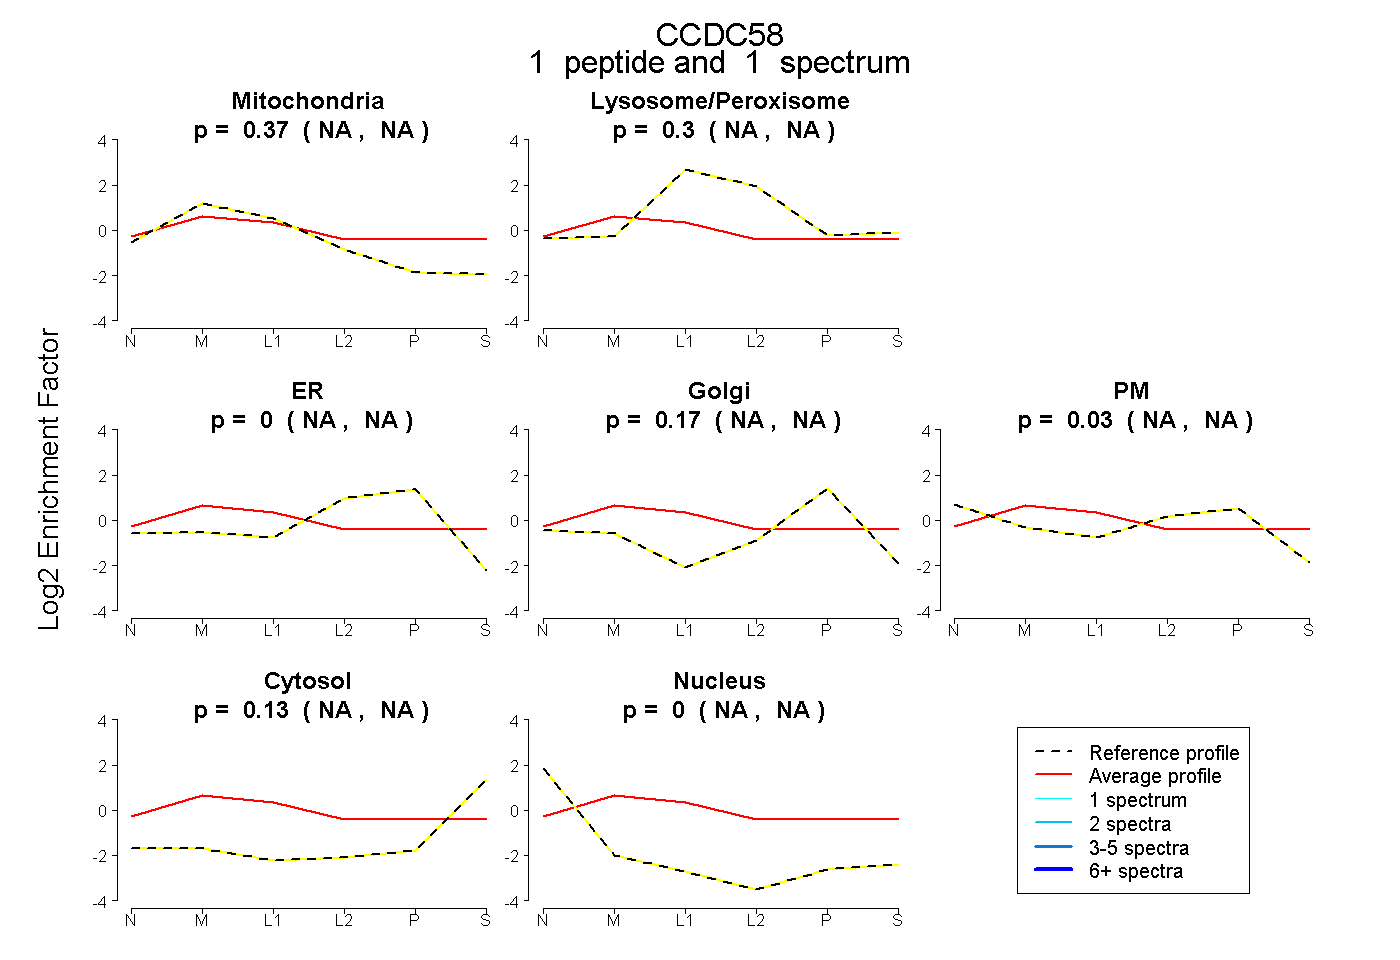
NA | NA
NA | NA
NA | NA
NA | NA
NA | NA
NA | NA
NA | NA
5peptides
spectra
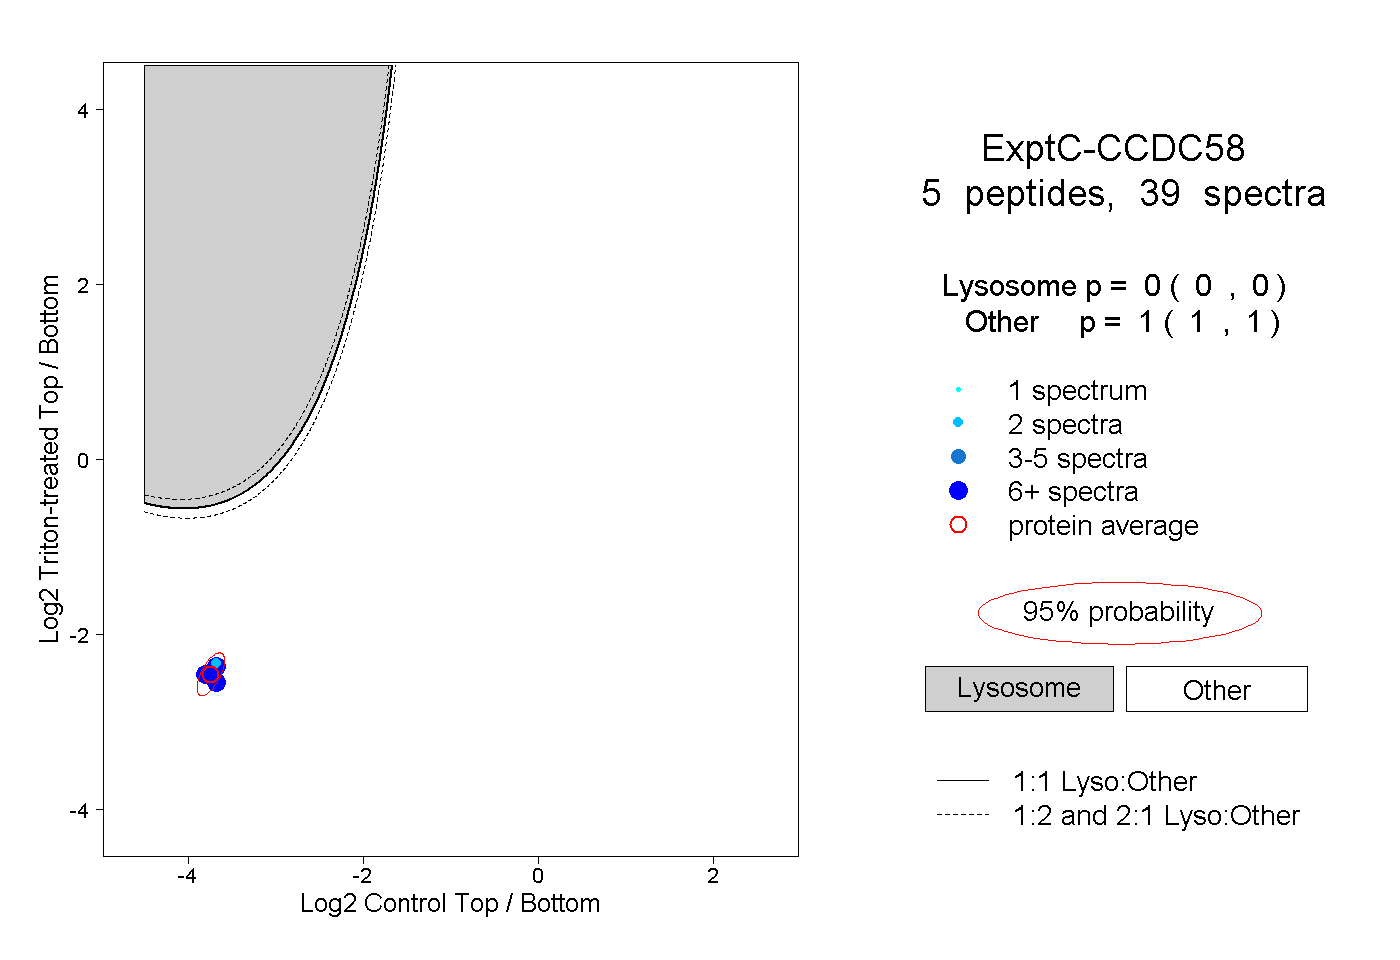
0.000 | 0.000
1.000 | 1.000
1peptide
spectra
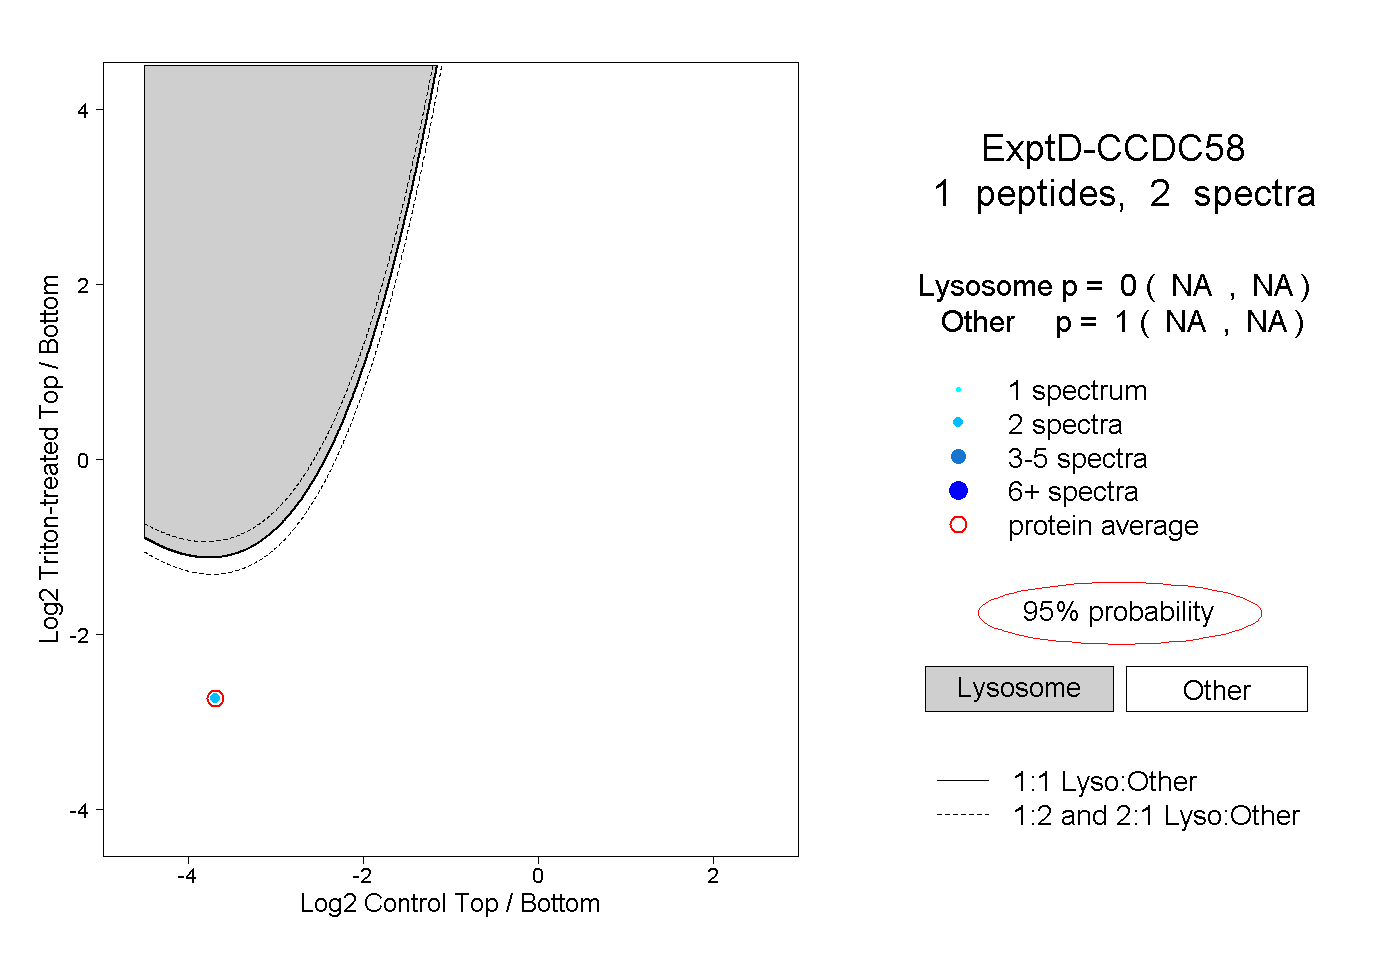
NA | NA
NA | NA