 5
5peptides
spectra
0.425 | 0.535
0.000 | 0.000
0.112 | 0.252
0.000 | 0.188
0.000 | 0.000
0.000 | 0.200
0.093 | 0.191
0.000 | 0.076
| Plot | Mito | Lyso | Perox | ER | Golgi | PM | Cytosol | Nucleus | |||||
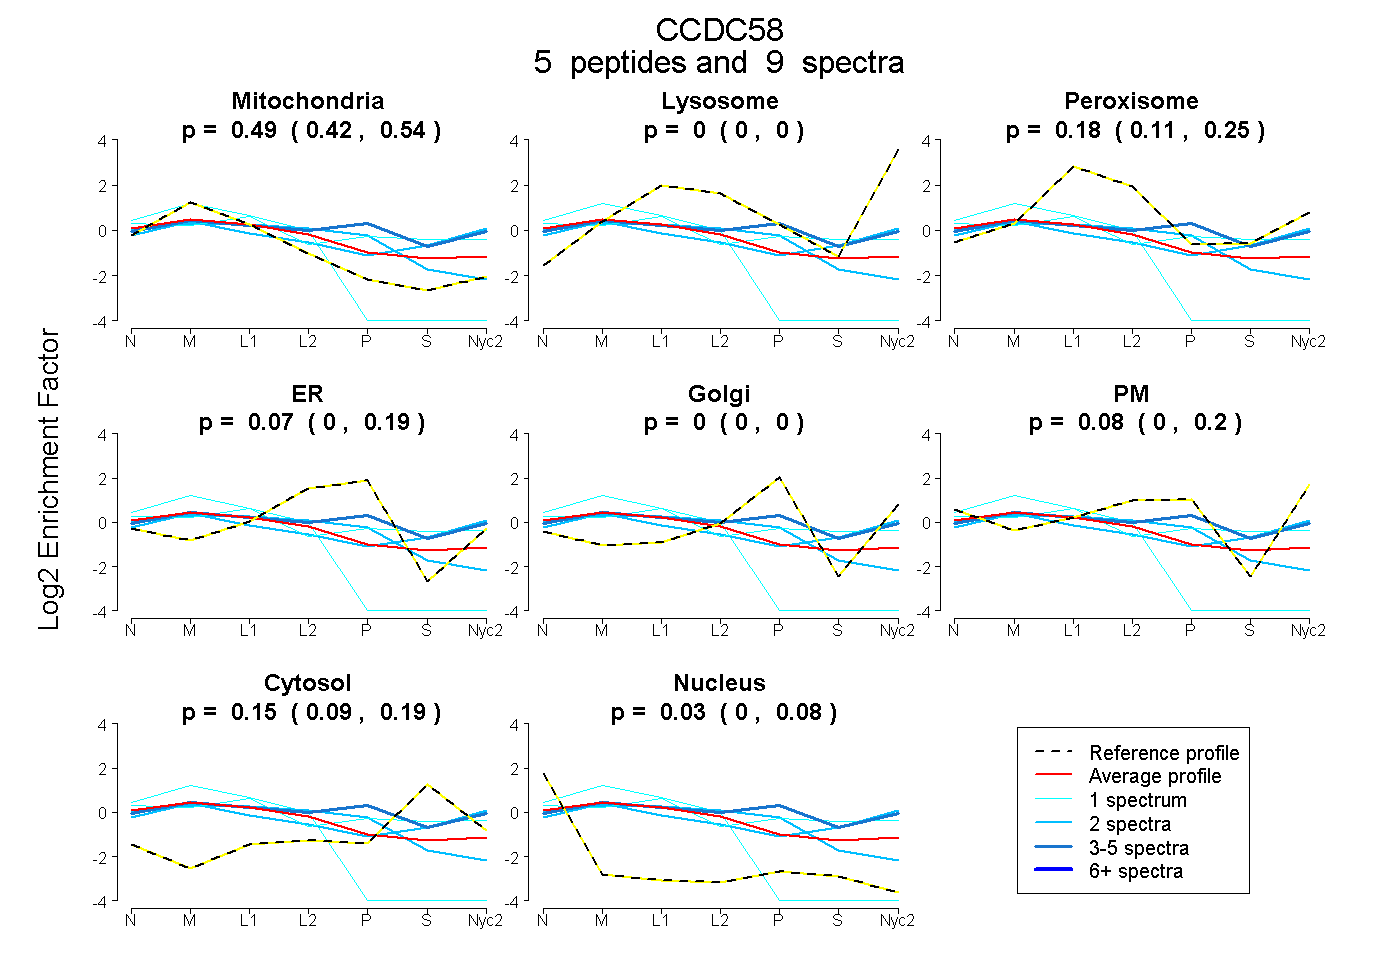
| Expt A |
5 peptides |
9 spectra |
|
0.488 0.425 | 0.535 |
0.000 0.000 | 0.000 |
0.185 0.112 | 0.252 |
0.075 0.000 | 0.188 |
0.000 0.000 | 0.000 |
0.077 0.000 | 0.200 |
0.149 0.093 | 0.191 |
0.027 0.000 | 0.076 |
| 3 spectra, WMQSELNVEEVVNDR | 0.212 | 0.000 | 0.286 | 0.000 | 0.300 | 0.063 | 0.139 | 0.000 | ||
| 1 spectrum, QLYESLMAAHVSR | 0.289 | 0.000 | 0.237 | 0.000 | 0.036 | 0.182 | 0.255 | 0.000 | ||
| 2 spectra, NLDDLTLLK | 0.400 | 0.196 | 0.000 | 0.000 | 0.000 | 0.117 | 0.287 | 0.000 | ||
| 1 spectrum, IVHELNTTVPTASFAGK | 0.938 | 0.000 | 0.000 | 0.000 | 0.000 | 0.000 | 0.000 | 0.062 | ||
| 2 spectra, NCIAQTSAVVK | 0.512 | 0.000 | 0.037 | 0.353 | 0.000 | 0.000 | 0.067 | 0.031 |
| Plot | Mito | Lyso or Perox | ER | Golgi | PM | Cytosol | Nucleus | ||||||
| Expt B |
1 peptide |
1 spectrum |
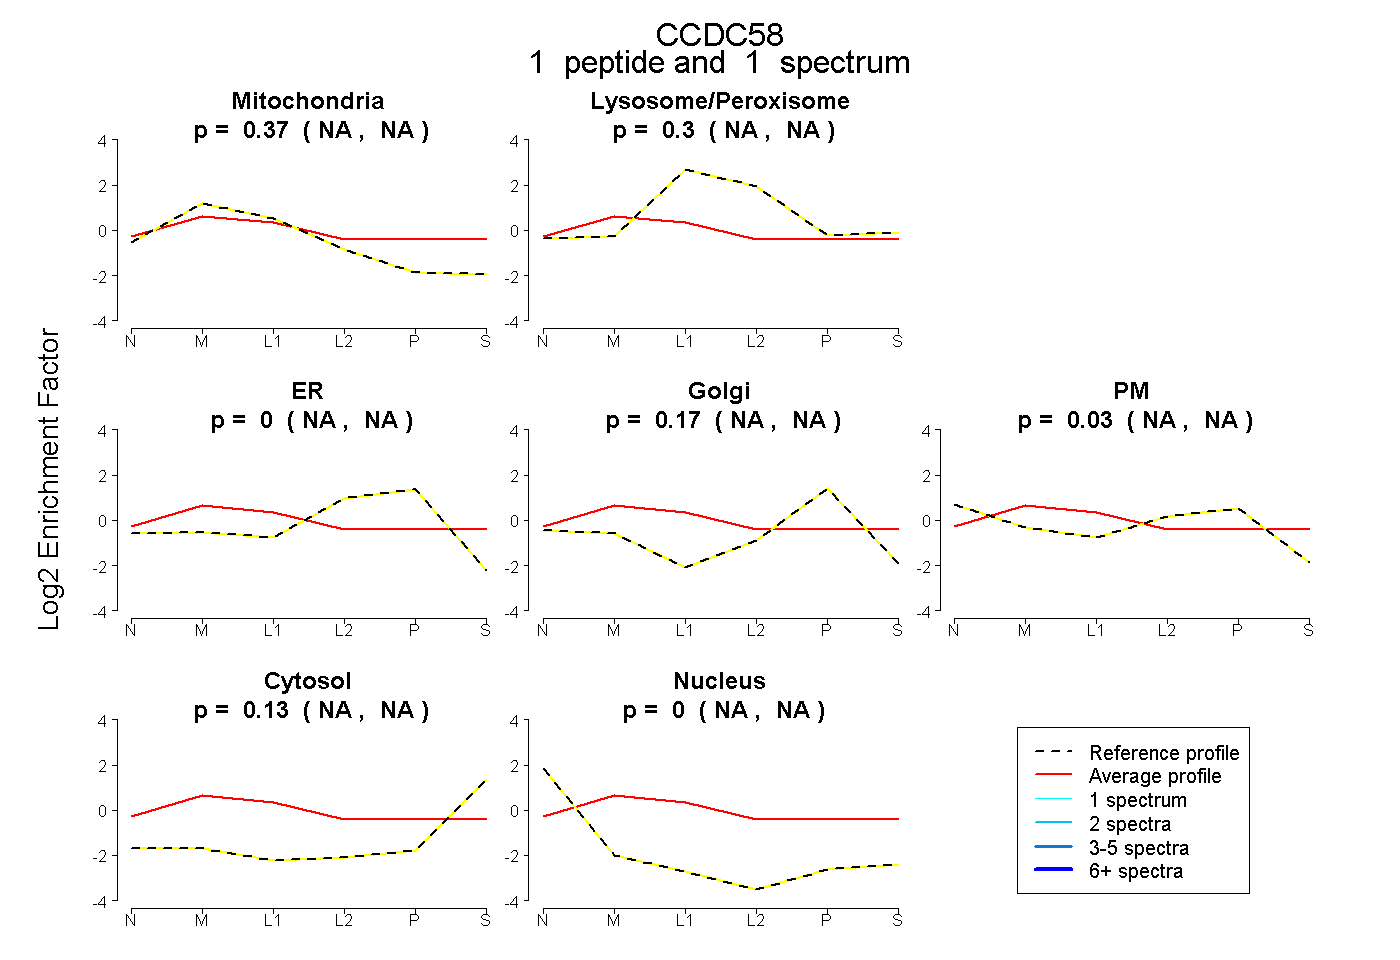 |
0.369 NA | NA |
0.297 NA | NA |
0.000 NA | NA |
0.175 NA | NA |
0.026 NA | NA |
0.133 NA | NA |
0.000 NA | NA |
|||
| Plot | Lyso | Other | |||||||||||
| Expt C |
5 peptides |
39 spectra |
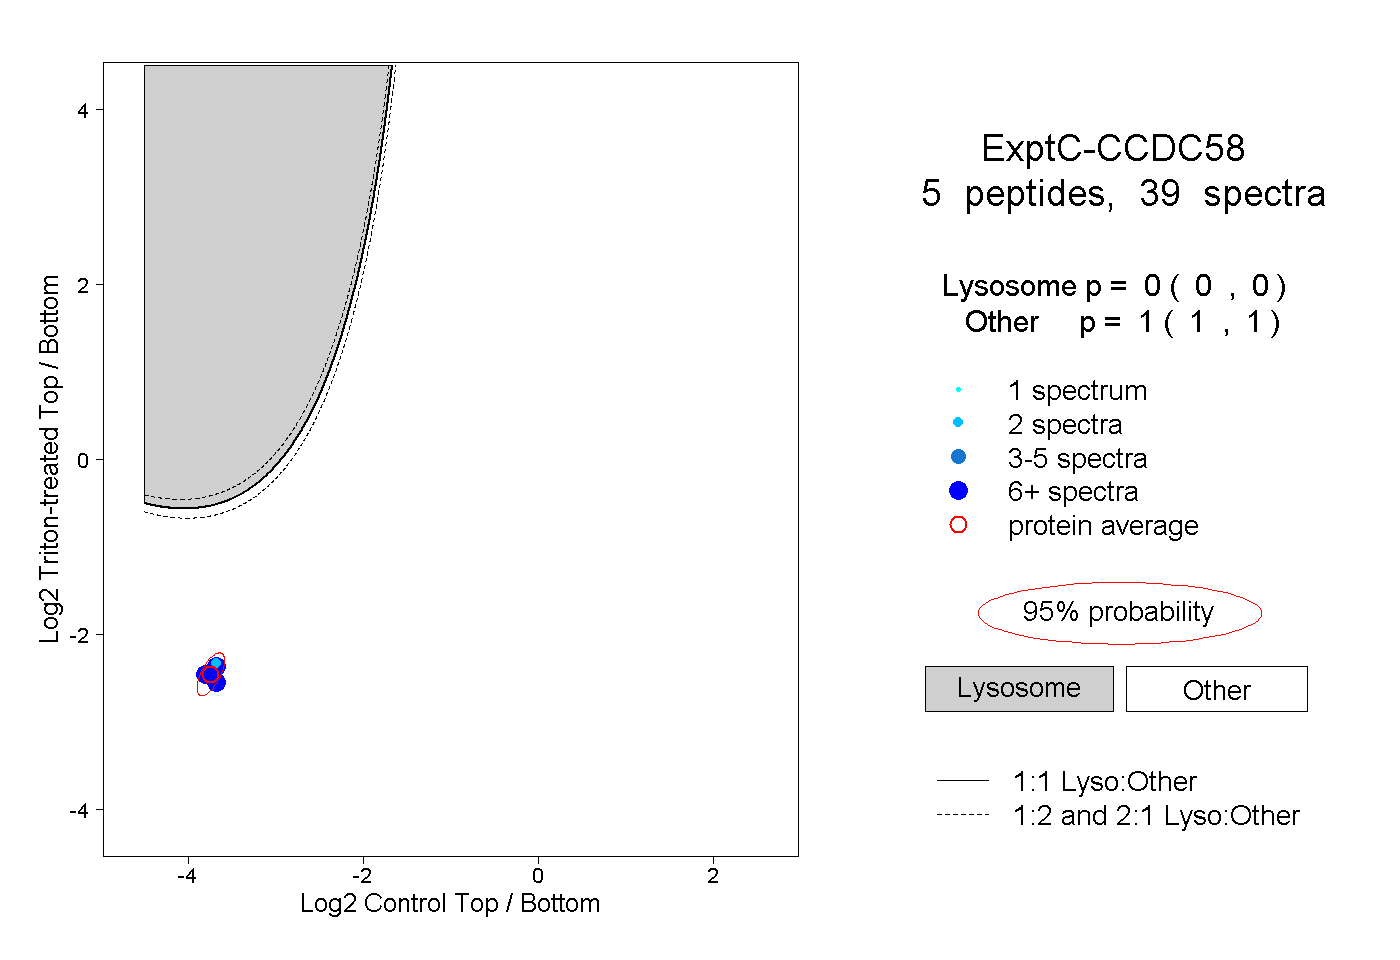 |
0.000 0.000 | 0.000 |
1.000 1.000 | 1.000 |
||||||||
| Plot | Lyso | Other | |||||||||||
| Expt D |
1 peptide |
2 spectra |
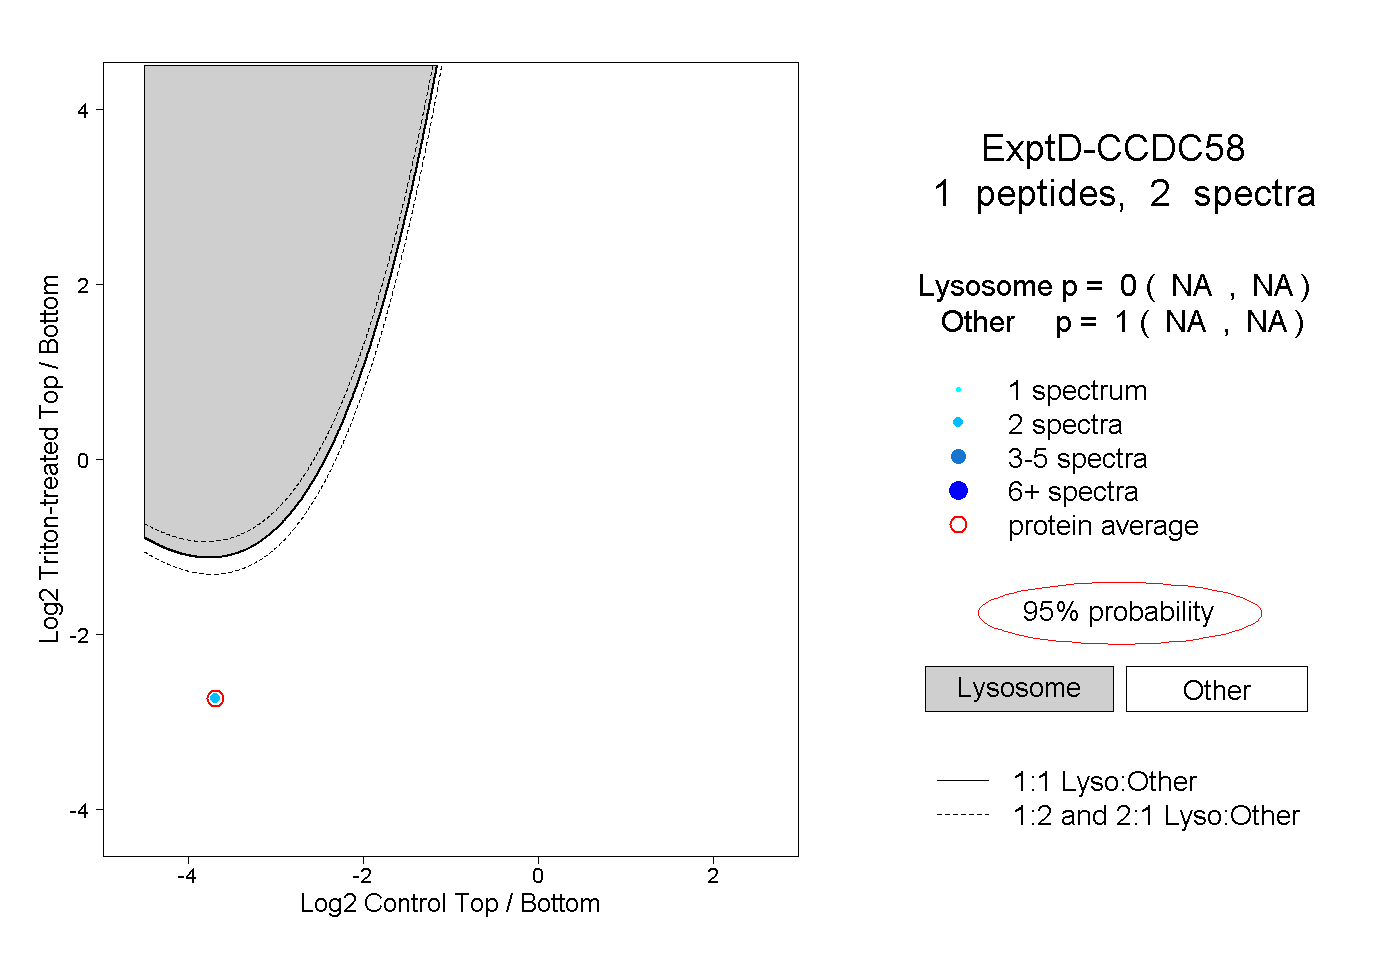 |
0.000 NA | NA |
1.000 NA | NA |