 11
11peptides
spectra
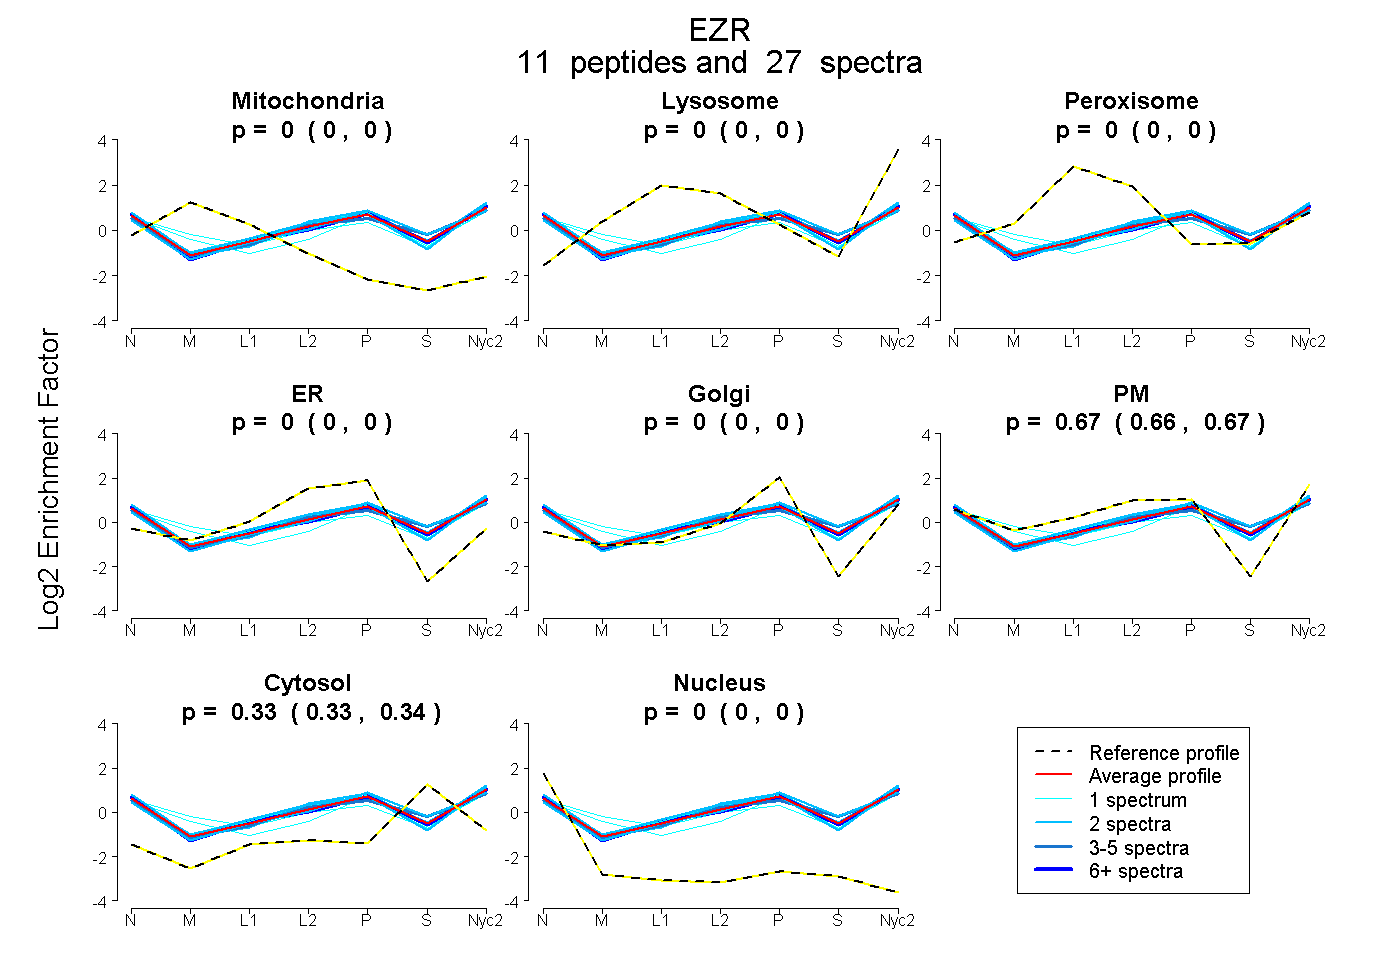
0.000 | 0.000
0.000 | 0.000
0.000 | 0.000
0.000 | 0.000
0.000 | 0.000
0.662 | 0.668
0.331 | 0.338
0.000 | 0.000
3peptides
spectra
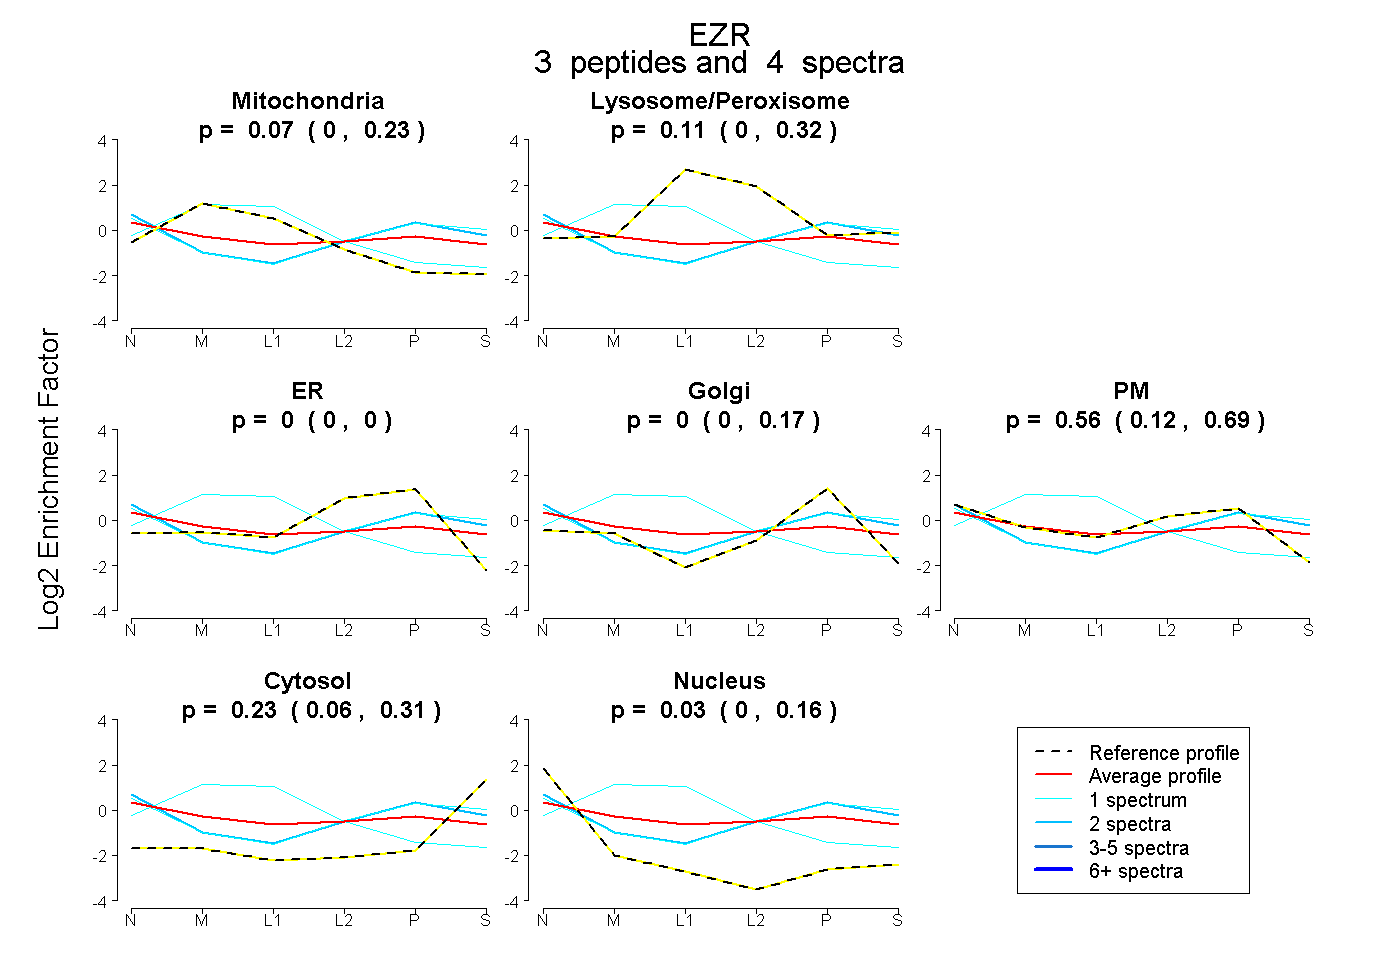
0.000 | 0.227
0.000 | 0.322
0.000 | 0.000
0.000 | 0.169
0.123 | 0.692
0.059 | 0.307
0.000 | 0.161
15peptides
spectra
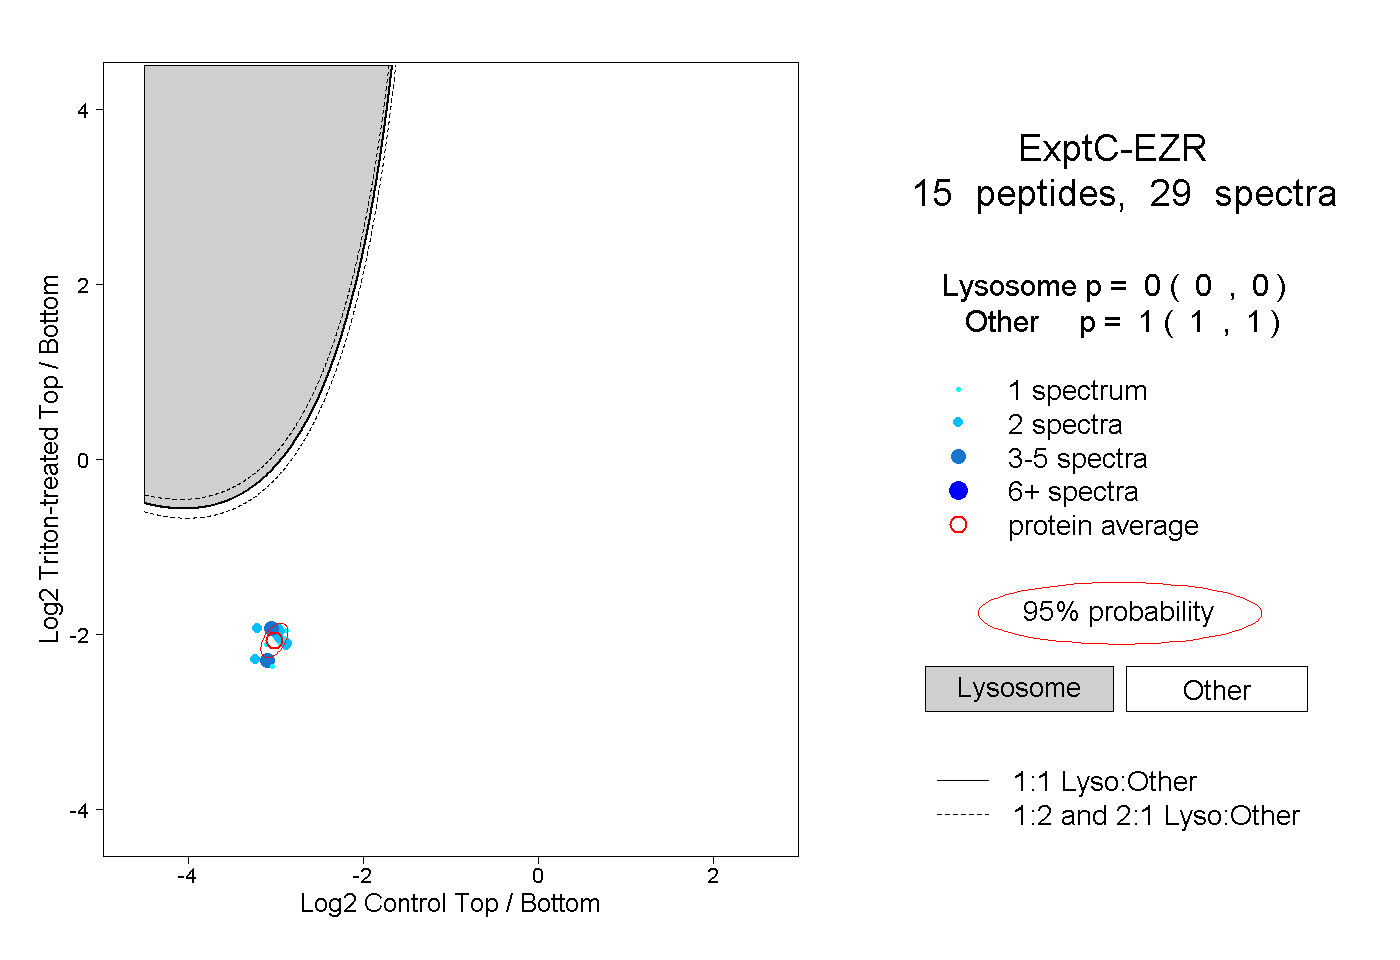
0.000 | 0.000
1.000 | 1.000
4peptides
spectra
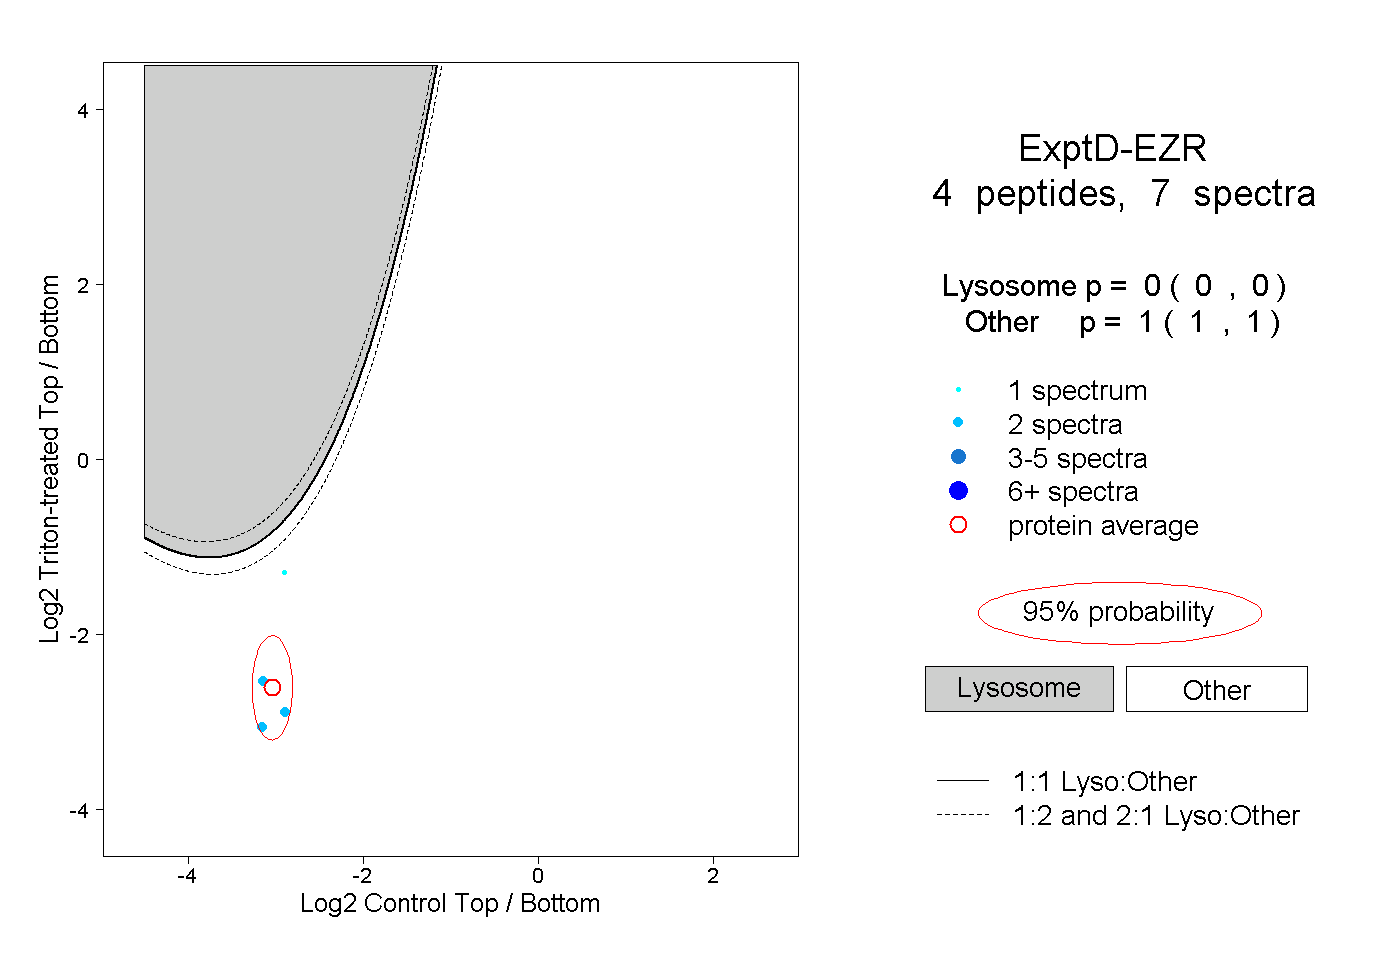
0.000 | 0.000
1.000 | 1.000