 11
11peptides
spectra
0.000 | 0.000
0.000 | 0.000
0.000 | 0.000
0.000 | 0.000
0.000 | 0.000
0.662 | 0.668
0.331 | 0.338
0.000 | 0.000
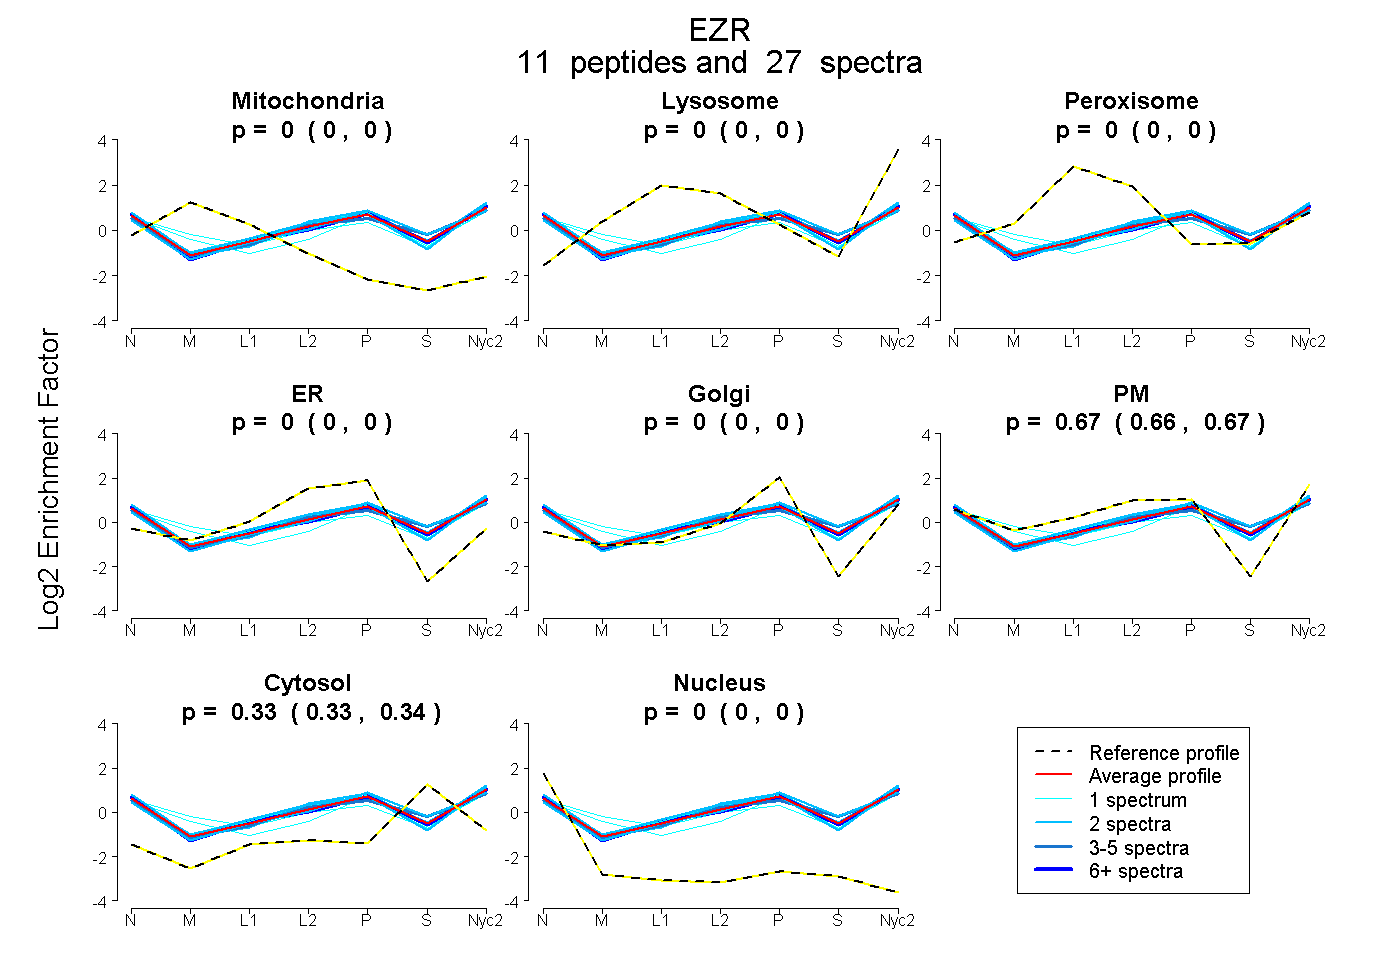
| Plot | Mito | Lyso | Perox | ER | Golgi | PM | Cytosol | Nucleus | |||||
| Expt A |
11 peptides |
27 spectra |
|
0.000 0.000 | 0.000 |
0.000 0.000 | 0.000 |
0.000 0.000 | 0.000 |
0.000 0.000 | 0.000 |
0.000 0.000 | 0.000 |
0.665 0.662 | 0.668 |
0.335 0.331 | 0.338 |
0.000 0.000 | 0.000 |
| 1 spectrum, QLLTLSNELSQAR | 0.000 | 0.000 | 0.000 | 0.000 | 0.000 | 0.727 | 0.273 | 0.000 | ||
| 9 spectra, LQDFEQK | 0.000 | 0.000 | 0.000 | 0.000 | 0.000 | 0.660 | 0.340 | 0.000 | ||
| 2 spectra, VSAQEVR | 0.000 | 0.000 | 0.000 | 0.000 | 0.058 | 0.568 | 0.375 | 0.000 | ||
| 4 spectra, QAQDQIK | 0.000 | 0.000 | 0.000 | 0.000 | 0.000 | 0.612 | 0.388 | 0.000 | ||
| 2 spectra, ELSEQIEK | 0.000 | 0.000 | 0.000 | 0.000 | 0.000 | 0.669 | 0.331 | 0.000 | ||
| 1 spectrum, IAQDLEMYGINYFEIK | 0.025 | 0.000 | 0.000 | 0.000 | 0.000 | 0.691 | 0.284 | 0.000 | ||
| 1 spectrum, EDEVEEWQHR | 0.000 | 0.000 | 0.000 | 0.000 | 0.146 | 0.537 | 0.293 | 0.024 | ||
| 2 spectra, VMDQHK | 0.000 | 0.000 | 0.000 | 0.000 | 0.000 | 0.732 | 0.268 | 0.000 | ||
| 2 spectra, ALQLEEER | 0.000 | 0.000 | 0.000 | 0.000 | 0.000 | 0.677 | 0.323 | 0.000 | ||
| 2 spectra, LALLEEAR | 0.000 | 0.000 | 0.000 | 0.000 | 0.007 | 0.686 | 0.307 | 0.000 | ||
| 1 spectrum, DQWEDR | 0.000 | 0.000 | 0.000 | 0.000 | 0.000 | 0.680 | 0.320 | 0.000 |
| Plot | Mito | Lyso or Perox | ER | Golgi | PM | Cytosol | Nucleus | ||||||
| Expt B |
3 peptides |
4 spectra |
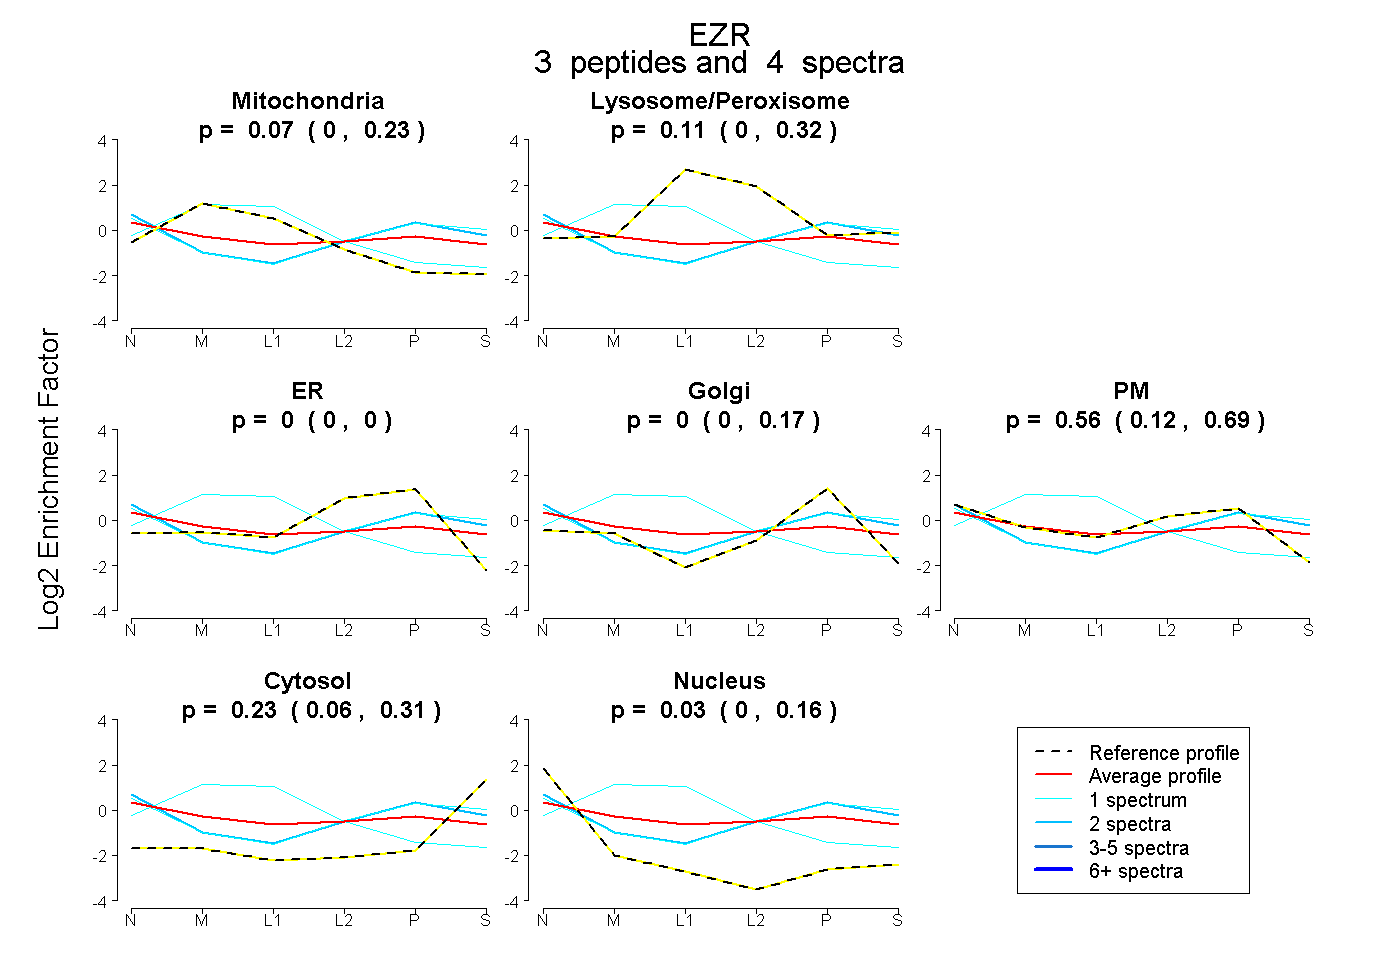 |
0.073 0.000 | 0.227 |
0.113 0.000 | 0.322 |
0.000 0.000 | 0.000 |
0.000 0.000 | 0.169 |
0.558 0.123 | 0.692 |
0.226 0.059 | 0.307 |
0.031 0.000 | 0.161 |
|||
| Plot | Lyso | Other | |||||||||||
| Expt C |
15 peptides |
29 spectra |
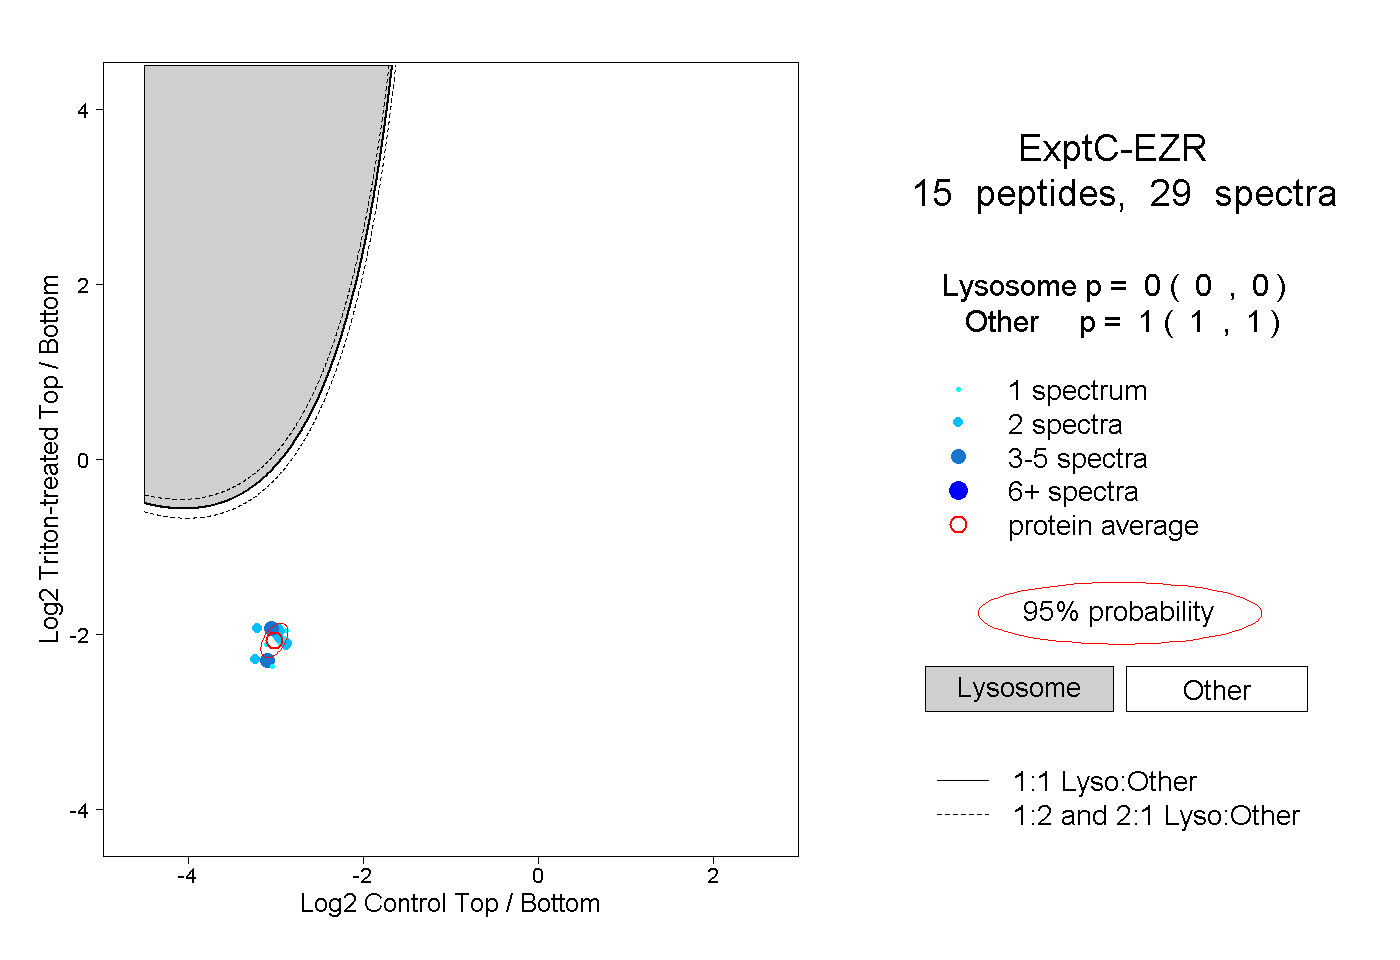 |
0.000 0.000 | 0.000 |
1.000 1.000 | 1.000 |
||||||||
| Plot | Lyso | Other | |||||||||||
| Expt D |
4 peptides |
7 spectra |
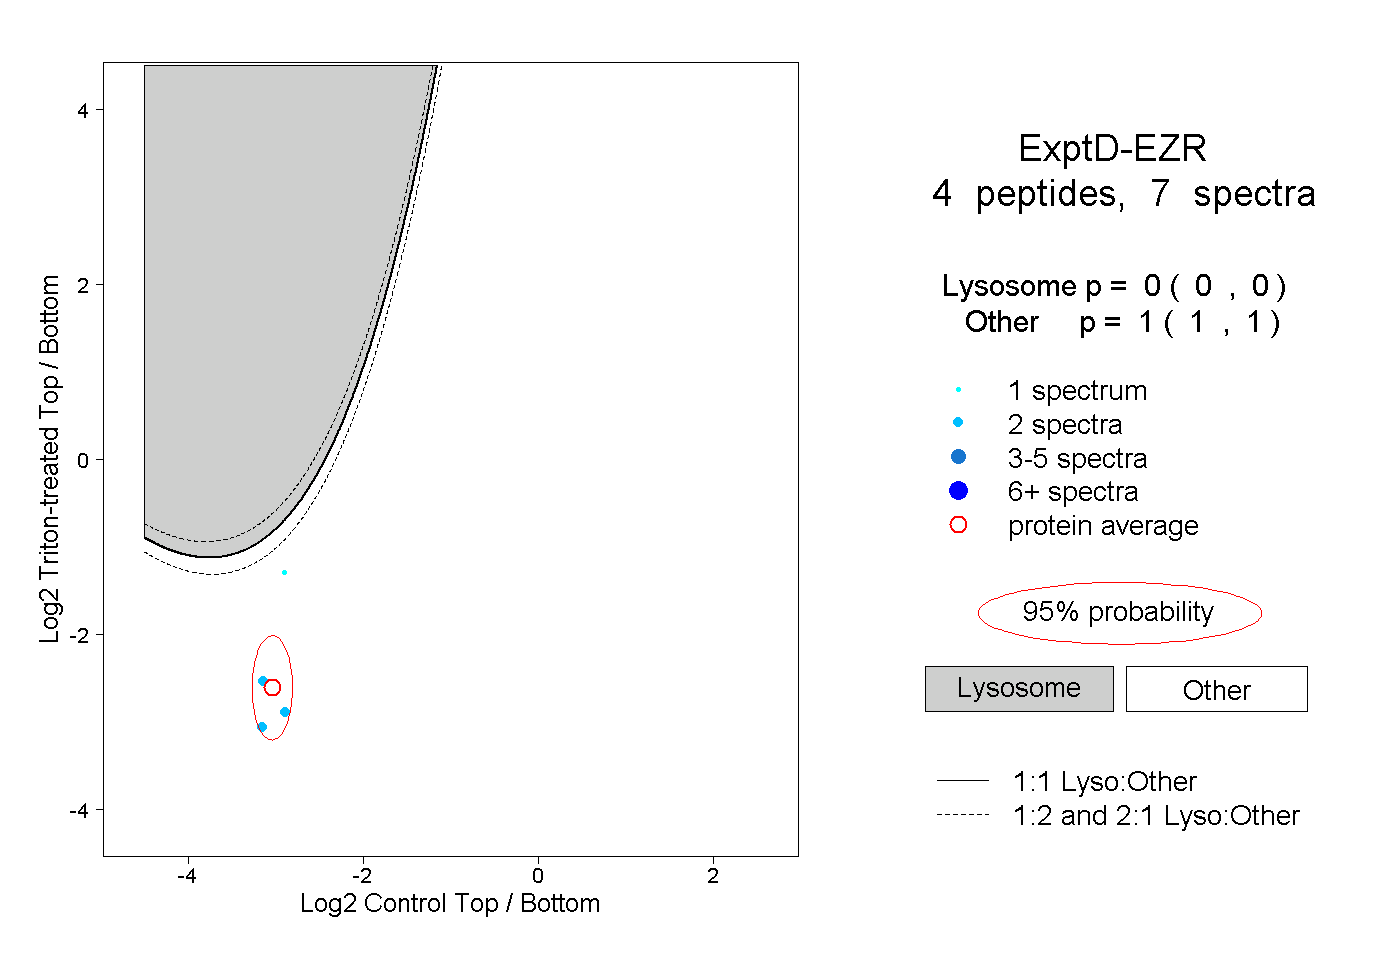 |
0.000 0.000 | 0.000 |
1.000 1.000 | 1.000 |