 11
11peptides
spectra
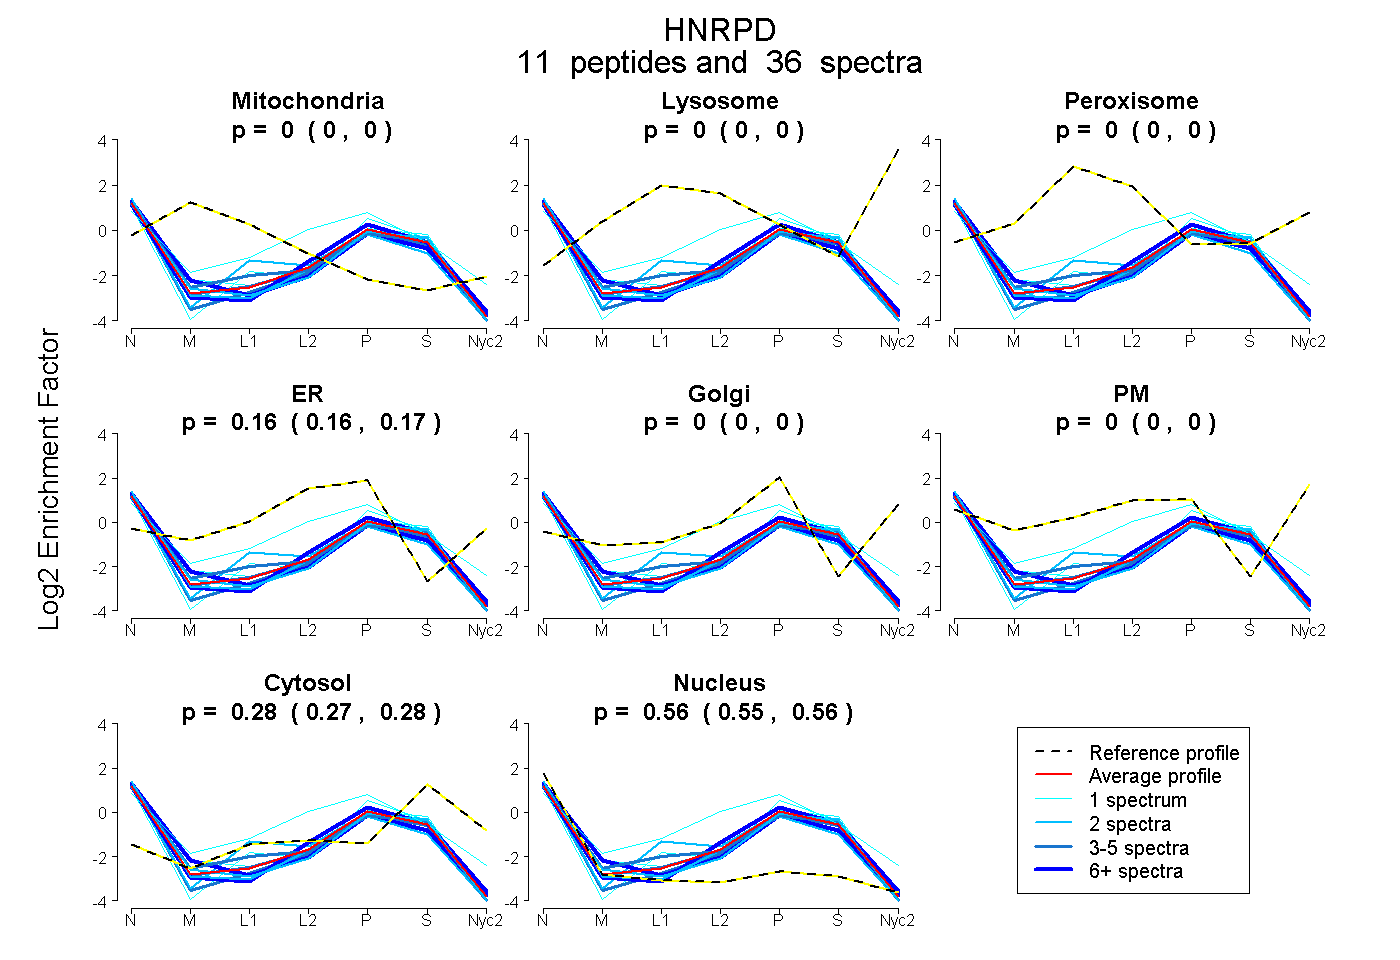
0.000 | 0.000
0.000 | 0.000
0.000 | 0.000
0.157 | 0.168
0.000 | 0.000
0.000 | 0.000
0.275 | 0.283
0.553 | 0.561
5peptides
spectra
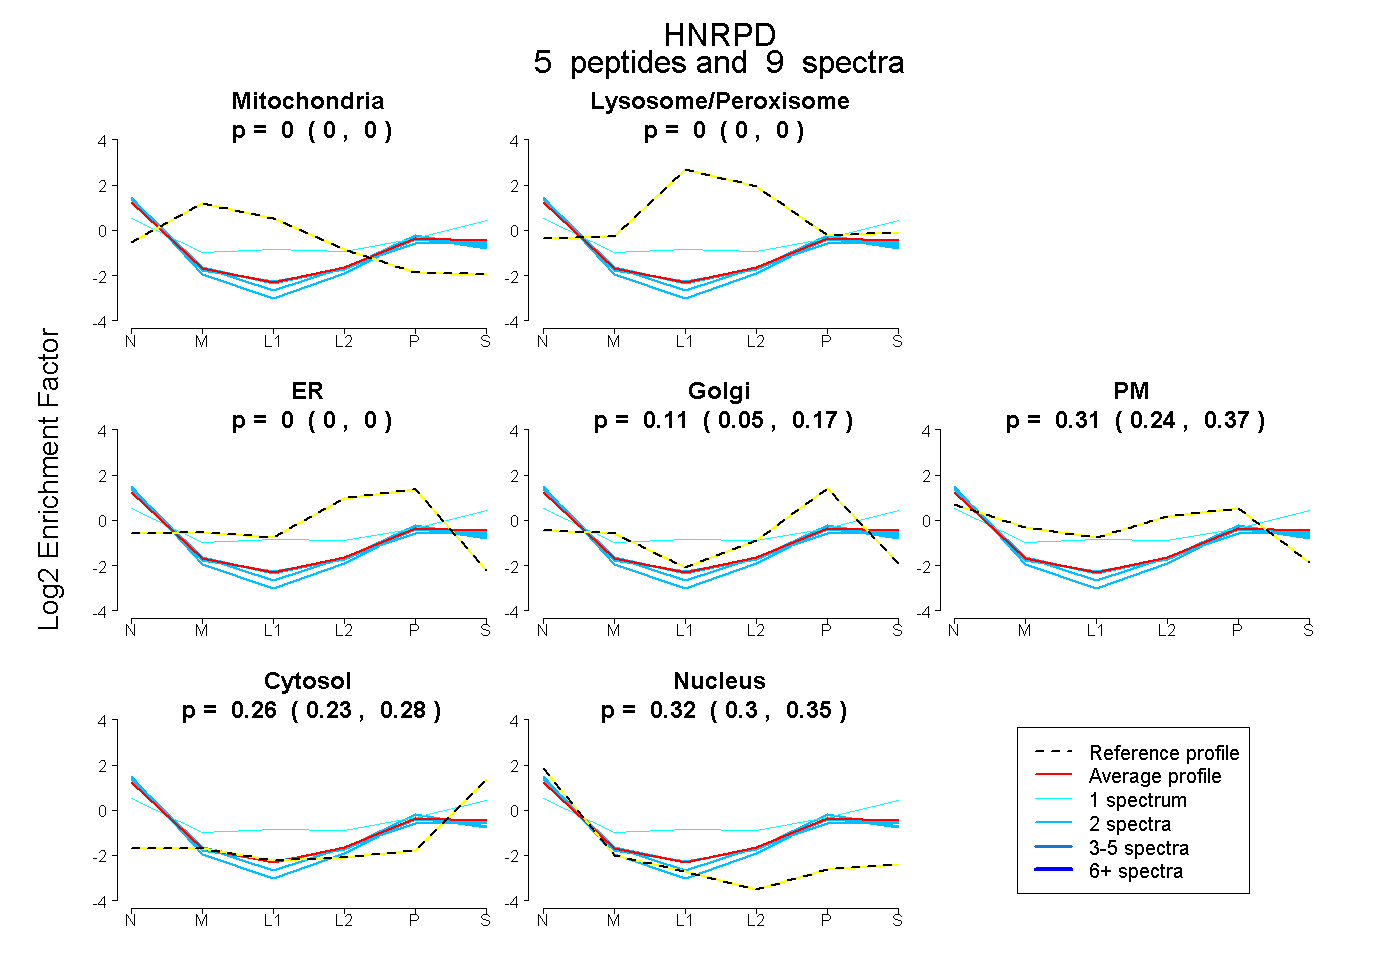
0.000 | 0.000
0.000 | 0.000
0.000 | 0.000
0.049 | 0.165
0.240 | 0.365
0.227 | 0.280
0.301 | 0.345
8peptides
spectra
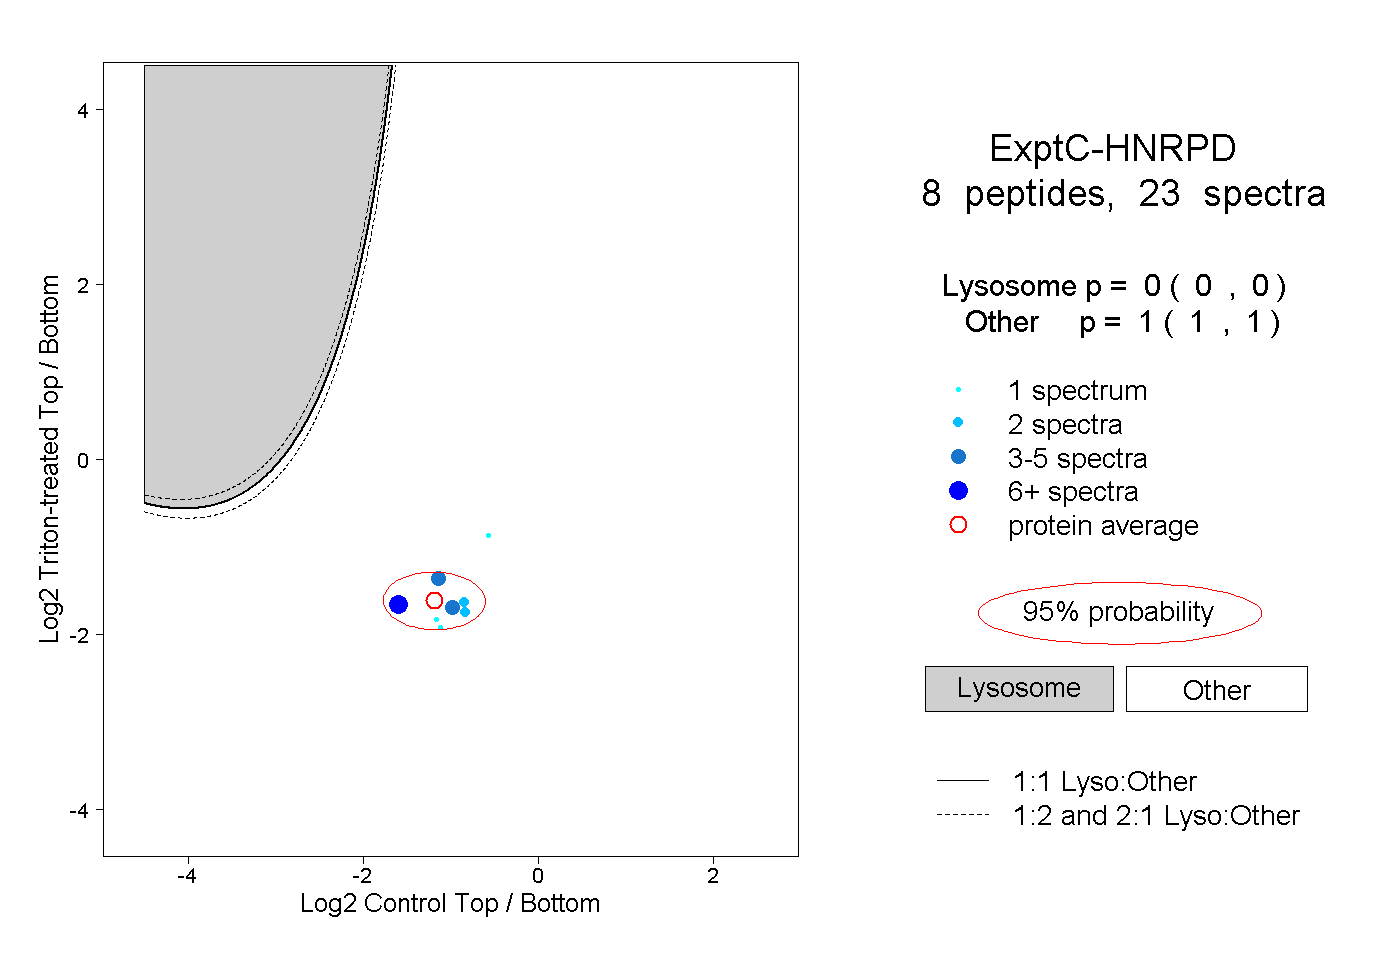
0.000 | 0.000
1.000 | 1.000
2peptides
spectra
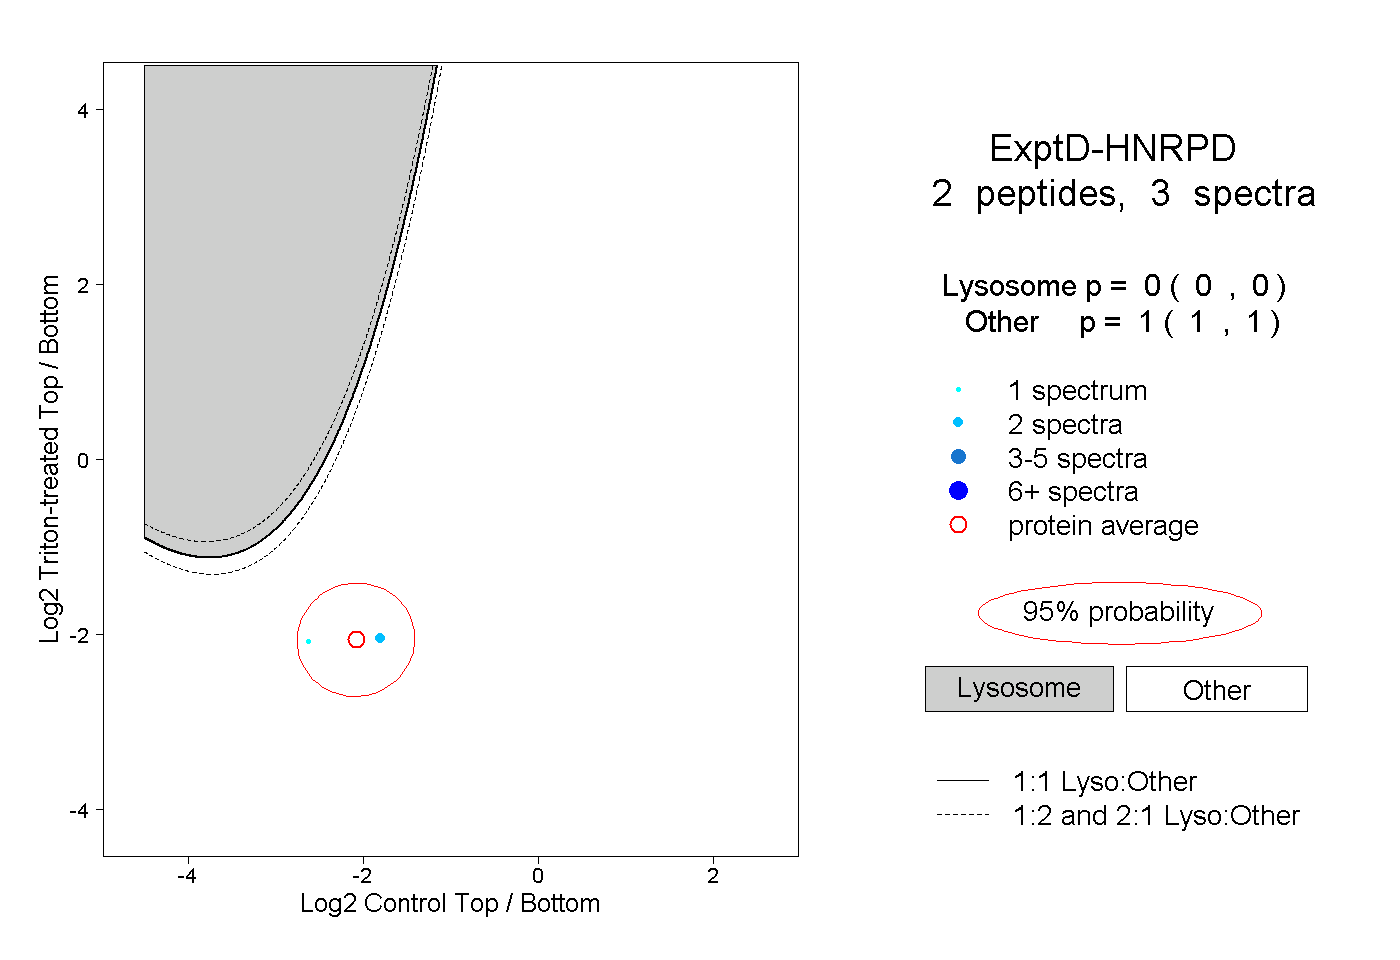
0.000 | 0.000
1.000 | 1.000