 11
11peptides
spectra
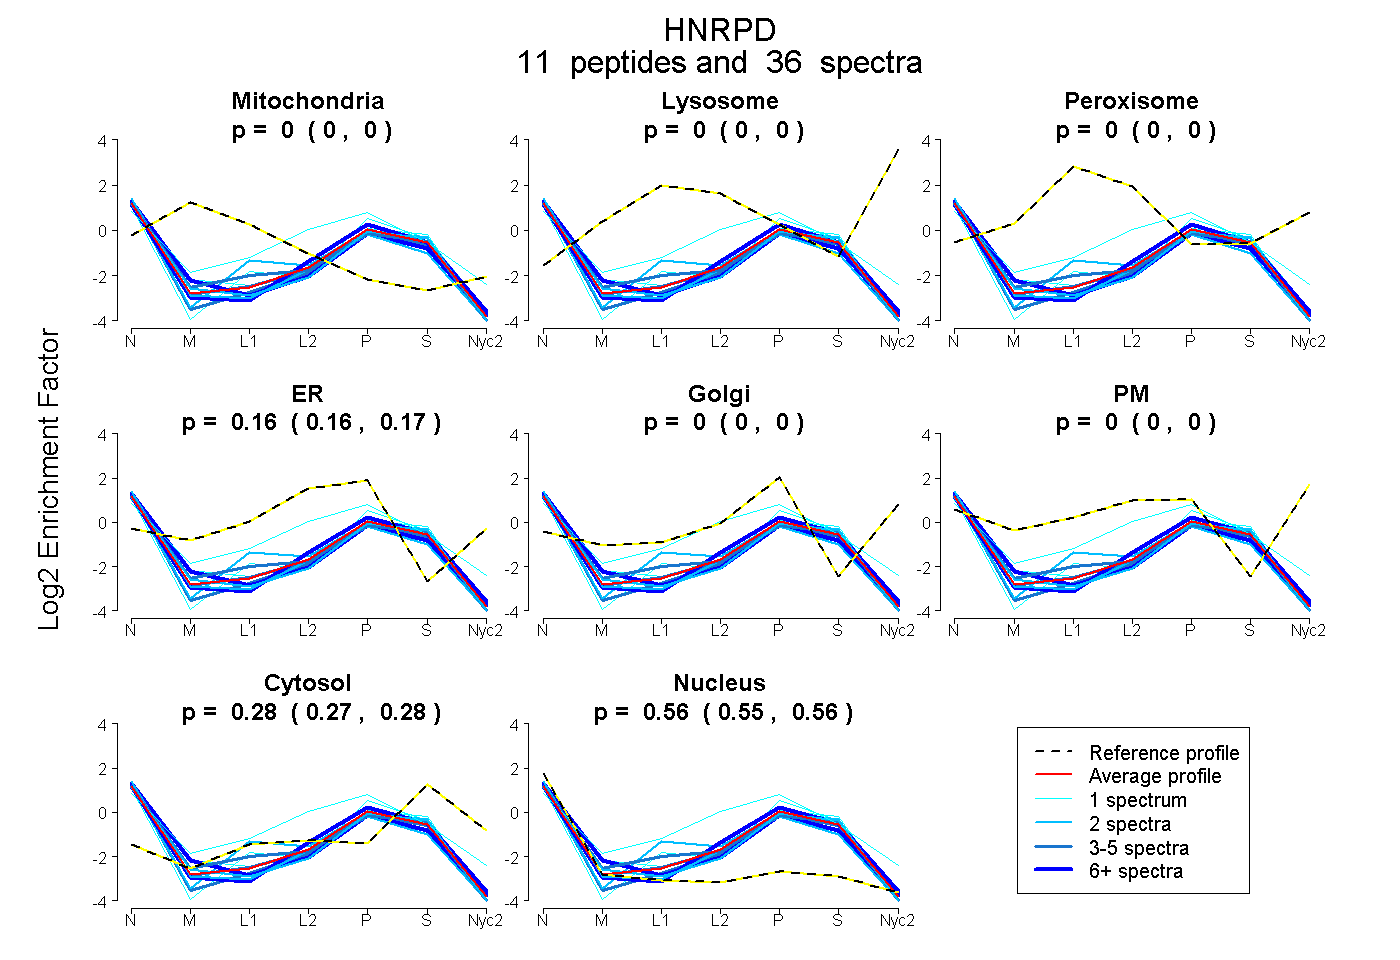
0.000 | 0.000
0.000 | 0.000
0.000 | 0.000
0.157 | 0.168
0.000 | 0.000
0.000 | 0.000
0.275 | 0.283
0.553 | 0.561
| Plot | Mito | Lyso | Perox | ER | Golgi | PM | Cytosol | Nucleus | |||||
| Expt A |
11 peptides |
36 spectra |
|
0.000 0.000 | 0.000 |
0.000 0.000 | 0.000 |
0.000 0.000 | 0.000 |
0.163 0.157 | 0.168 |
0.000 0.000 | 0.000 |
0.000 0.000 | 0.000 |
0.279 0.275 | 0.283 |
0.558 0.553 | 0.561 |
| 1 spectrum, YHNVGLSK | 0.000 | 0.000 | 0.000 | 0.485 | 0.000 | 0.000 | 0.272 | 0.243 | ||
| 1 spectrum, EYFGGFGEVESIELPMDNK | 0.000 | 0.000 | 0.000 | 0.146 | 0.000 | 0.000 | 0.330 | 0.524 | ||
| 2 spectra, MFIGGLSWDTTK | 0.000 | 0.000 | 0.000 | 0.095 | 0.000 | 0.000 | 0.316 | 0.589 | ||
| 2 spectra, IFVGGLSPDTPEEK | 0.000 | 0.000 | 0.000 | 0.152 | 0.000 | 0.000 | 0.188 | 0.661 | ||
| 5 spectra, FGDVVDCTLK | 0.000 | 0.000 | 0.000 | 0.143 | 0.000 | 0.000 | 0.280 | 0.577 | ||
| 2 spectra, GFCFITFK | 0.000 | 0.000 | 0.000 | 0.165 | 0.000 | 0.000 | 0.335 | 0.500 | ||
| 4 spectra, LDPITGR | 0.000 | 0.000 | 0.000 | 0.162 | 0.000 | 0.000 | 0.289 | 0.549 | ||
| 1 spectrum, EQYQQQQQWGSR | 0.000 | 0.000 | 0.000 | 0.141 | 0.000 | 0.000 | 0.362 | 0.497 | ||
| 4 spectra, ESESVDK | 0.000 | 0.000 | 0.000 | 0.096 | 0.000 | 0.000 | 0.285 | 0.619 | ||
| 6 spectra, HTEAATAQR | 0.000 | 0.000 | 0.000 | 0.173 | 0.000 | 0.000 | 0.288 | 0.539 | ||
| 8 spectra, GFGFVLFK | 0.000 | 0.000 | 0.000 | 0.156 | 0.000 | 0.000 | 0.226 | 0.618 |
| Plot | Mito | Lyso or Perox | ER | Golgi | PM | Cytosol | Nucleus | ||||||
| Expt B |
5 peptides |
9 spectra |
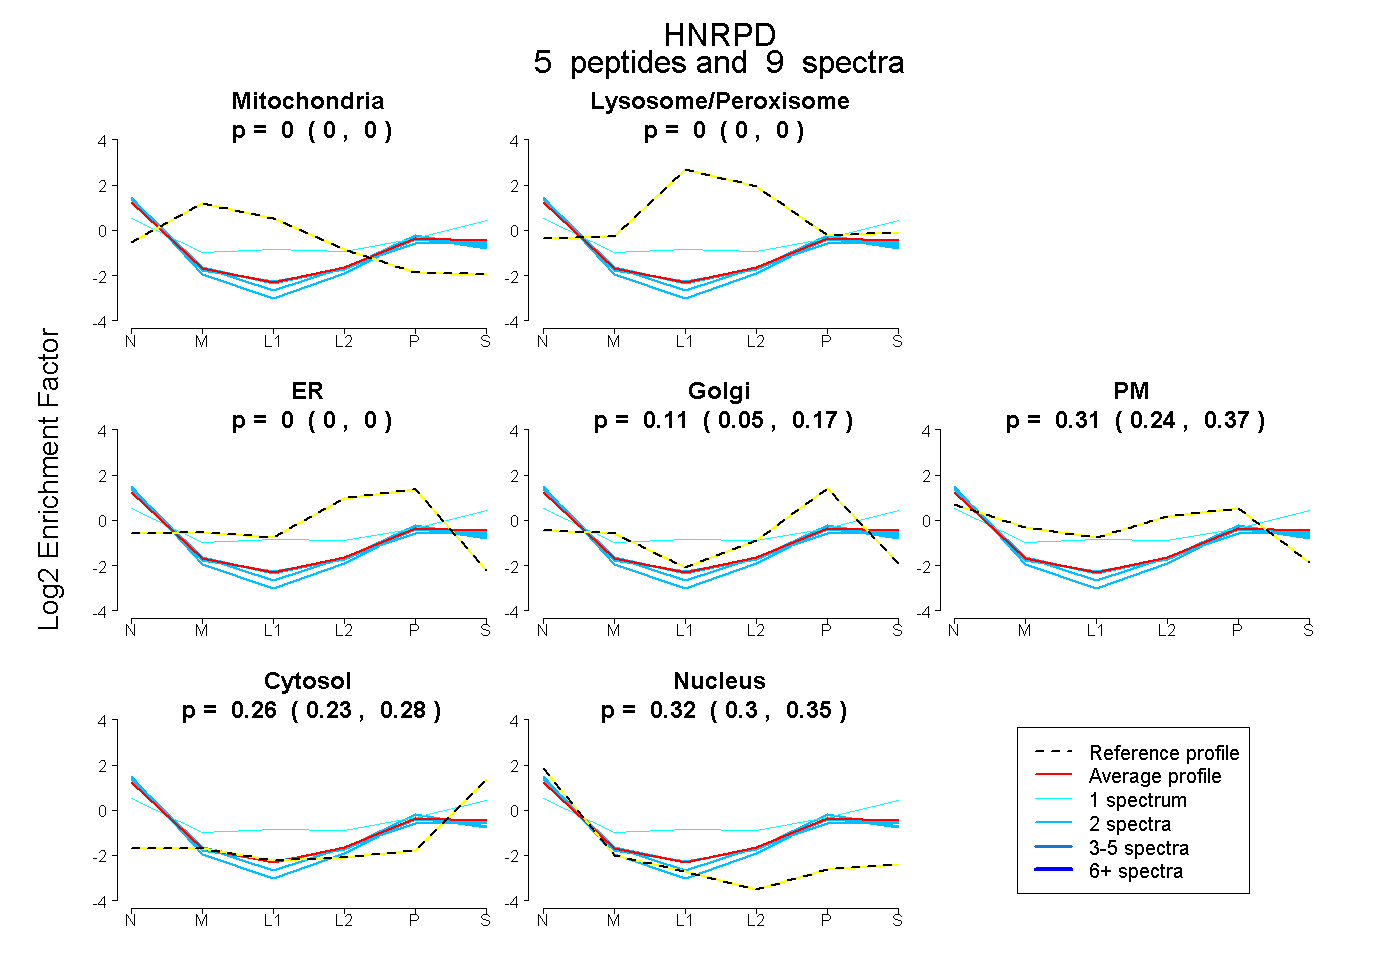 |
0.000 0.000 | 0.000 |
0.000 0.000 | 0.000 |
0.000 0.000 | 0.000 |
0.112 0.049 | 0.165 |
0.308 0.240 | 0.365 |
0.255 0.227 | 0.280 |
0.325 0.301 | 0.345 |
|||
| Plot | Lyso | Other | |||||||||||
| Expt C |
8 peptides |
23 spectra |
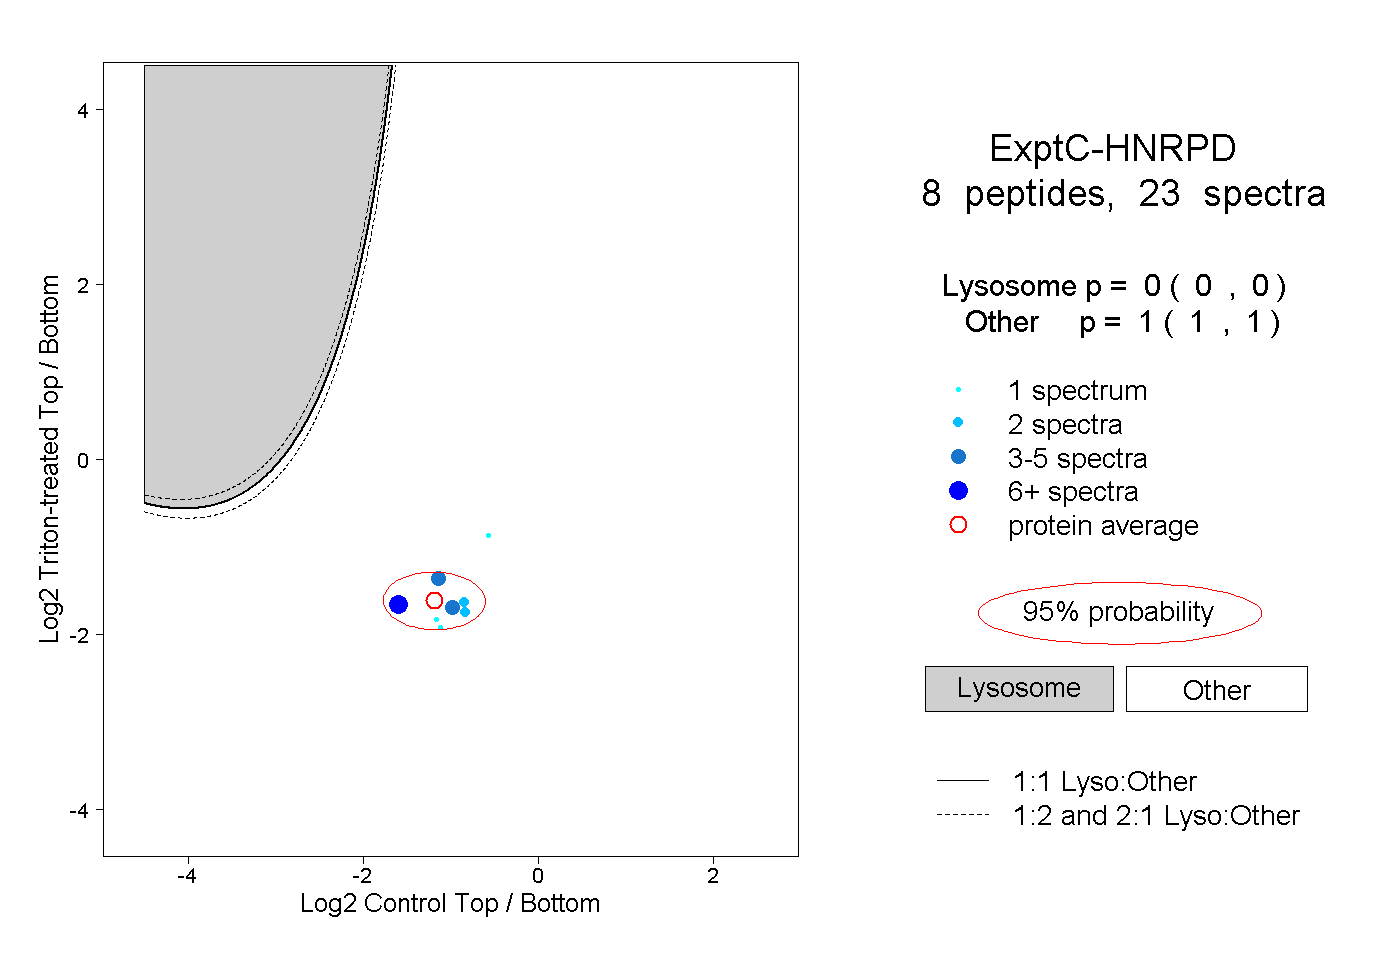 |
0.000 0.000 | 0.000 |
1.000 1.000 | 1.000 |
||||||||
| Plot | Lyso | Other | |||||||||||
| Expt D |
2 peptides |
3 spectra |
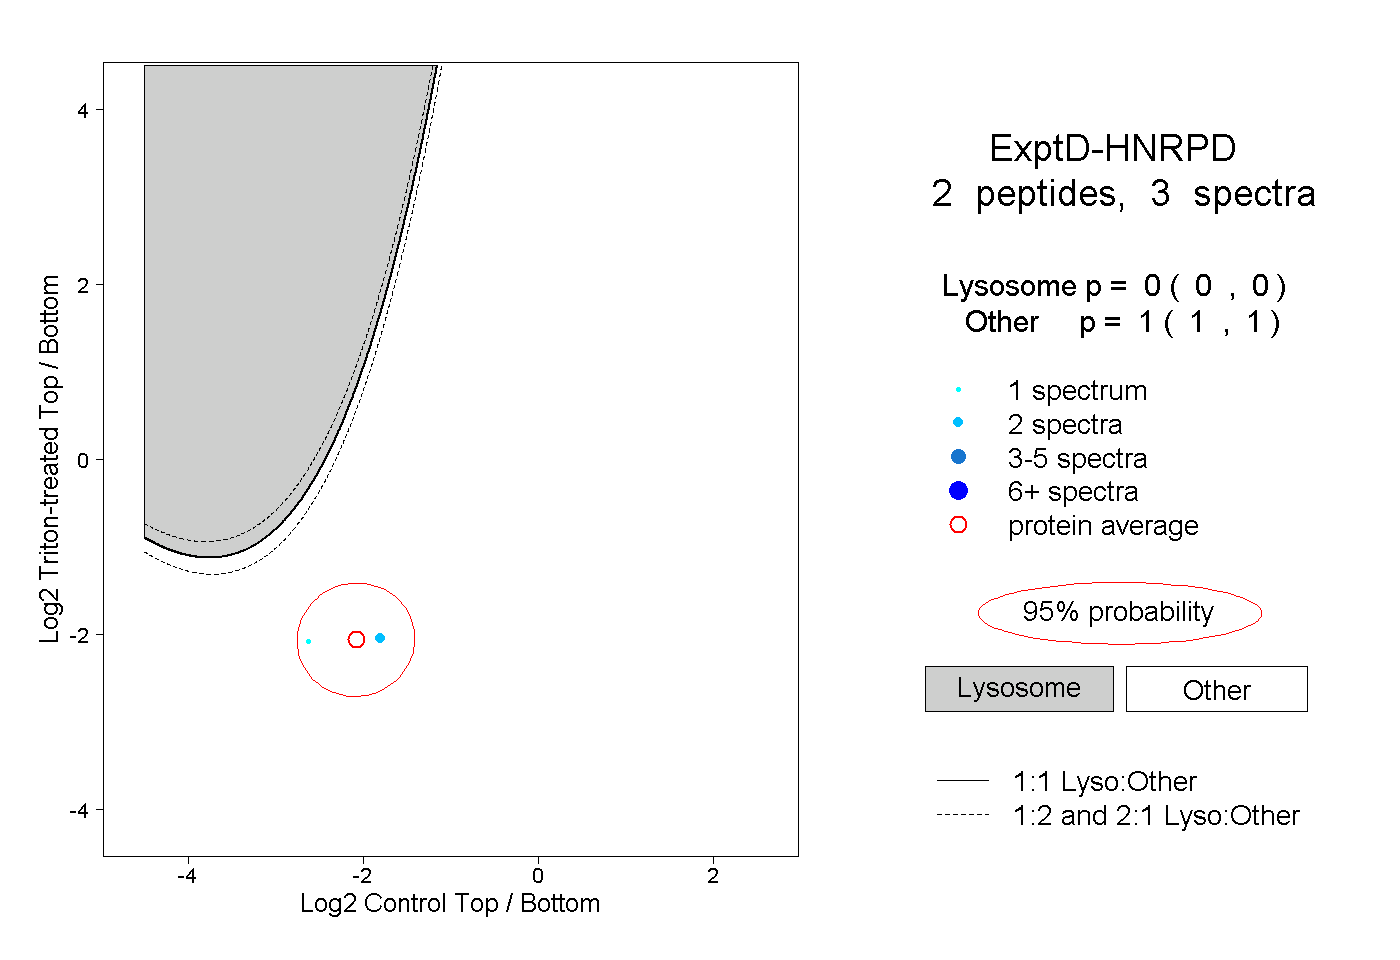 |
0.000 0.000 | 0.000 |
1.000 1.000 | 1.000 |