 3
3peptides
spectra
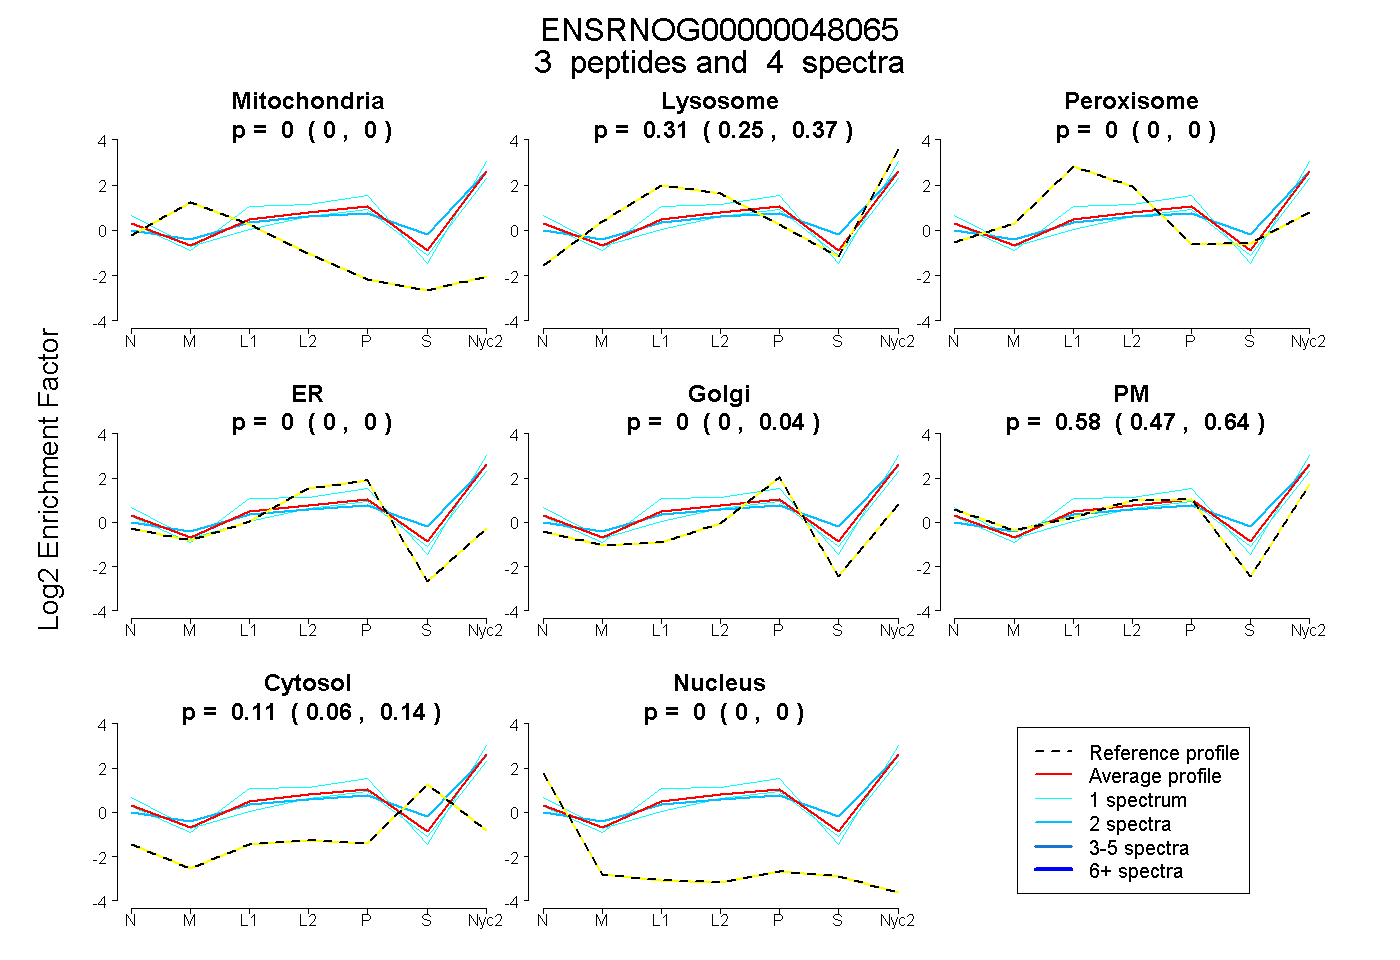
0.000 | 0.000
0.248 | 0.366
0.000 | 0.000
0.000 | 0.000
0.000 | 0.044
0.474 | 0.644
0.062 | 0.142
0.000 | 0.000
2peptides
spectra
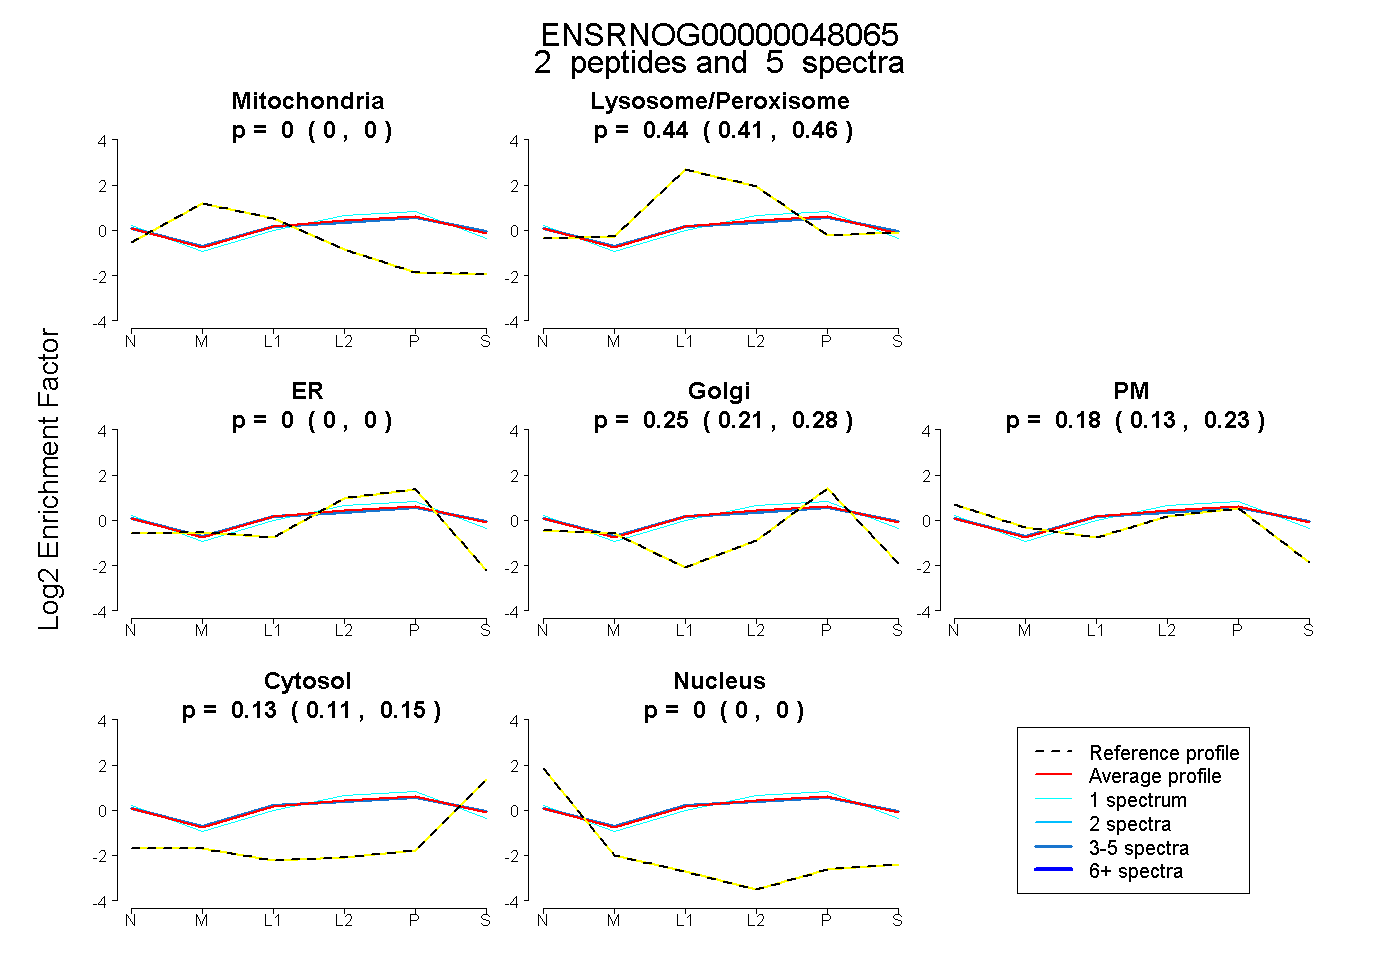
0.000 | 0.000
0.414 | 0.457
0.000 | 0.000
0.211 | 0.283
0.130 | 0.229
0.110 | 0.146
0.000 | 0.000
4peptides
spectra
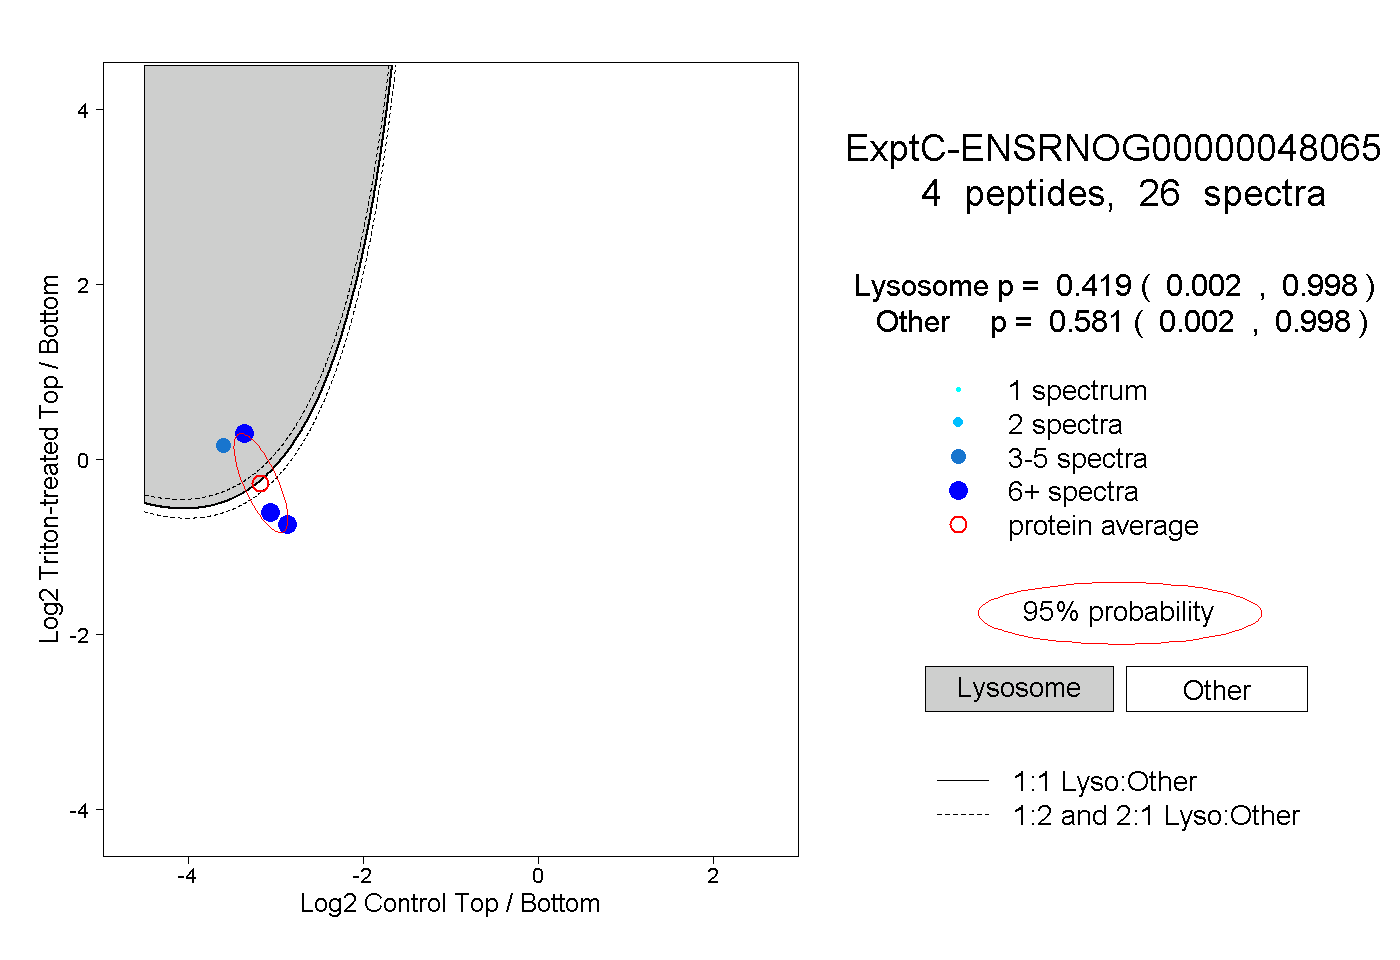
0.002 | 0.998
0.002 | 0.998