ENSRNOG00000048065
[ENSRNOP00000046429]
Main page
| | | Plot |
Mito |
Lyso |
|
Perox |
ER |
Golgi |
PM |
Cytosol |
Nucleus |
|
| Expt A |
 3
3
peptides |
4
spectra |
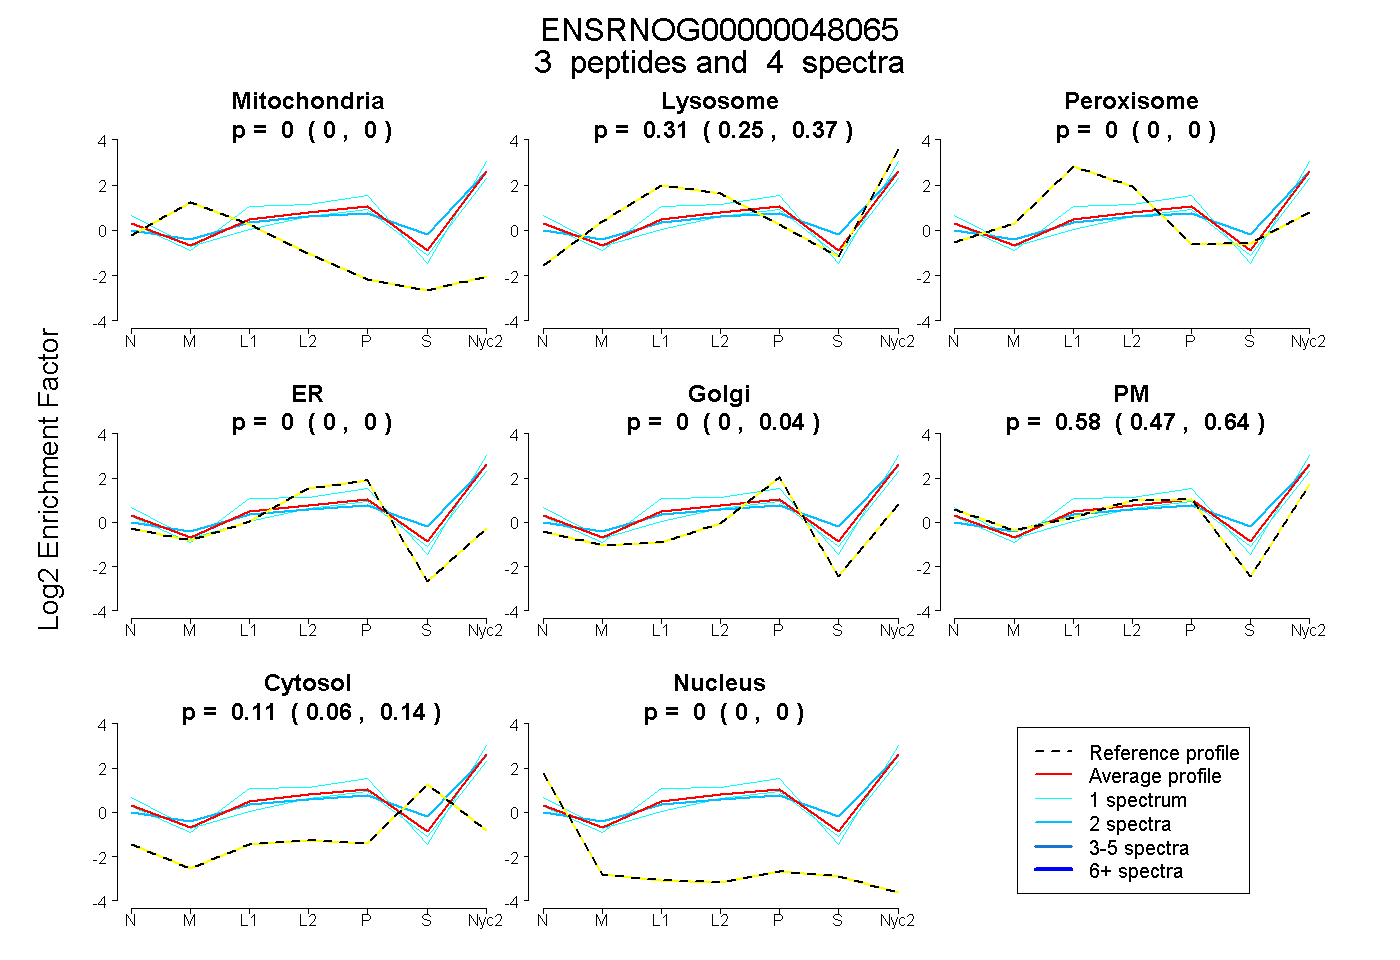 |
0.000
0.000 | 0.000 |
0.310
0.248 | 0.366 |
|
0.000
0.000 | 0.000 |
0.000
0.000 | 0.000 |
0.000
0.000 | 0.044 |
0.581
0.474 | 0.644 |
0.109
0.062 | 0.142 |
0.000
0.000 | 0.000 |
|
| | | Plot |
Mito |
|
Lyso or Perox |
|
ER |
Golgi |
PM |
Cytosol |
Nucleus |
|
| Expt B |
2
peptides |
5
spectra |
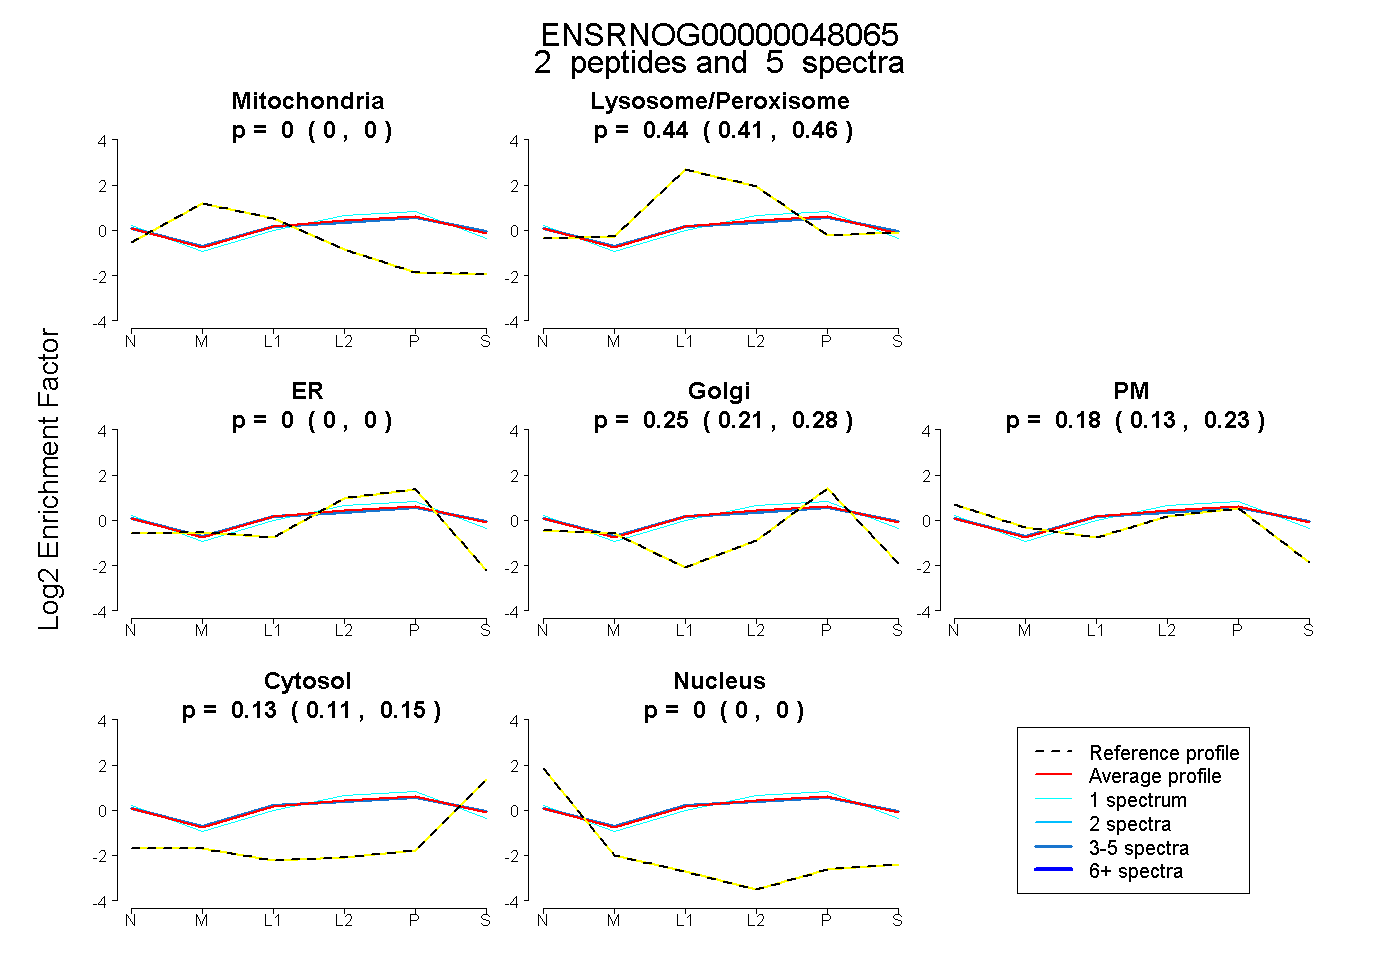 |
0.000
0.000 | 0.000 |
|
0.436
0.414 | 0.457 |
|
0.000
0.000 | 0.000 |
0.250
0.211 | 0.283 |
0.184
0.130 | 0.229 |
0.129
0.110 | 0.146 |
0.000
0.000 | 0.000 |
|
| 4 spectra, HGEAPK |
0.000 |
|
0.442 |
|
0.000 |
0.236 |
0.177 |
0.145 |
0.000 |
|
| 1 spectrum, ASQNINK |
0.000 |
|
0.415 |
|
0.000 |
0.307 |
0.211 |
0.067 |
0.000 |
|
| | | Plot |
|
Lyso |
|
|
|
|
|
|
|
Other |
| Expt C |
4
peptides |
26
spectra |
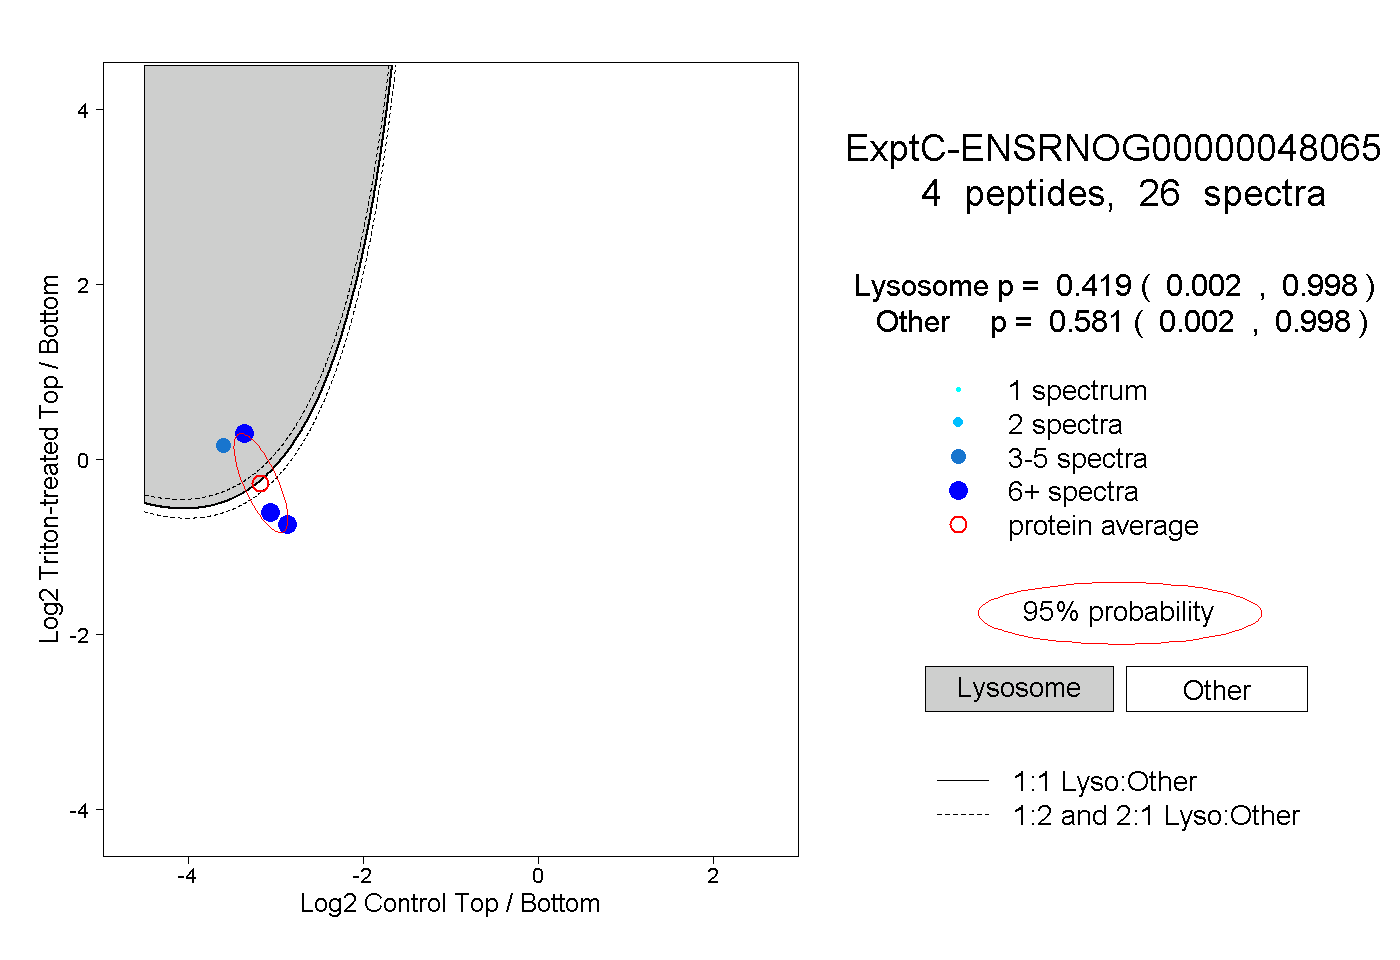 |
|
0.419
0.002 | 0.998 |
|
|
|
|
|
|
|
0.581
0.002 | 0.998 |