 5
5peptides
spectra
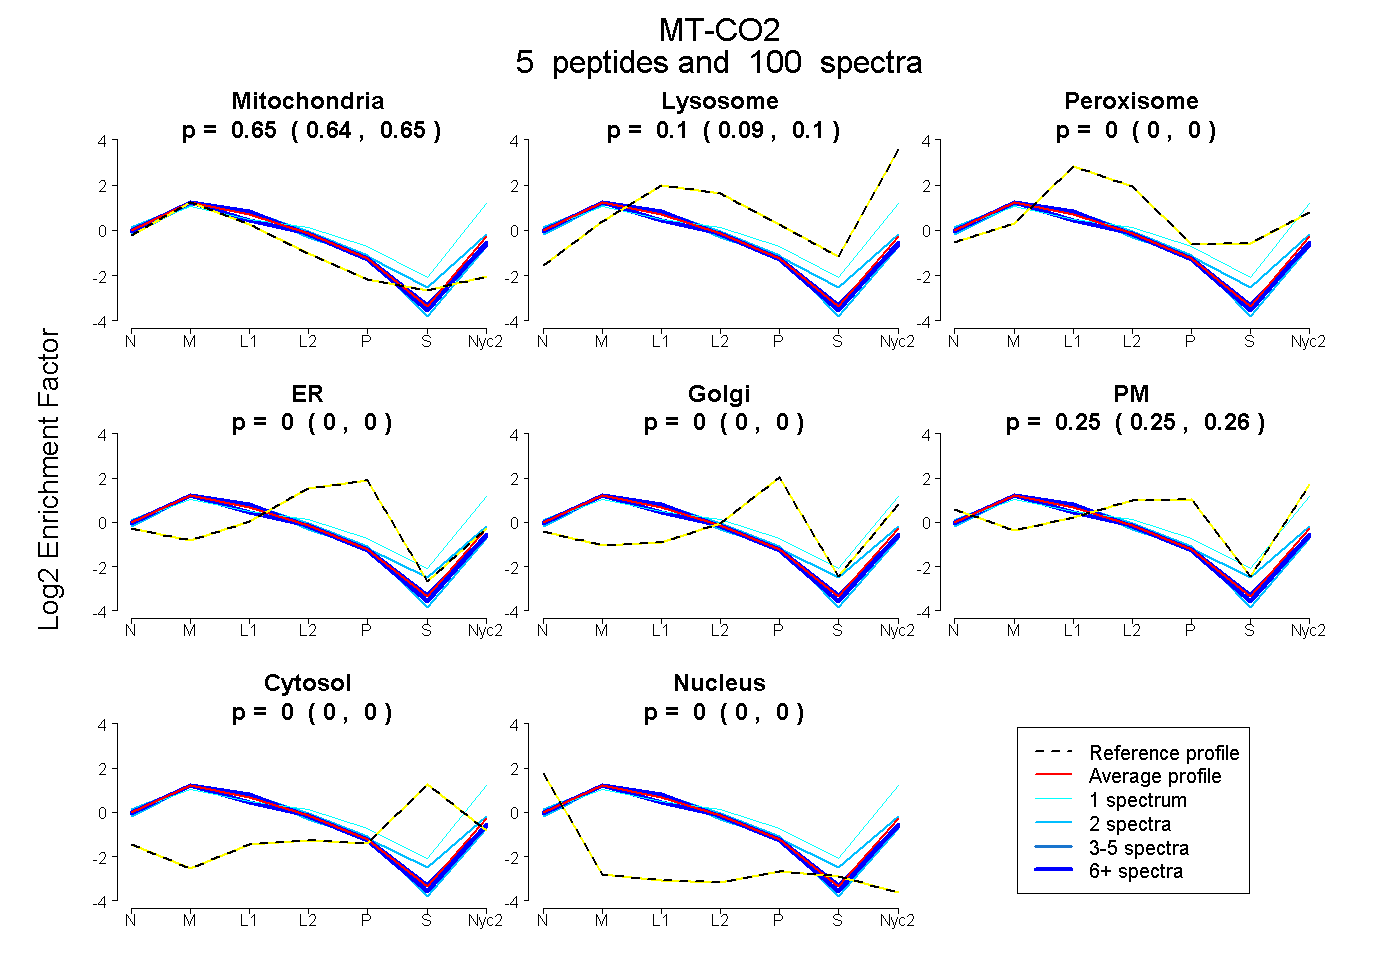
0.644 | 0.655
0.092 | 0.104
0.000 | 0.000
0.000 | 0.000
0.000 | 0.000
0.248 | 0.255
0.000 | 0.000
0.000 | 0.000
4peptides
spectra
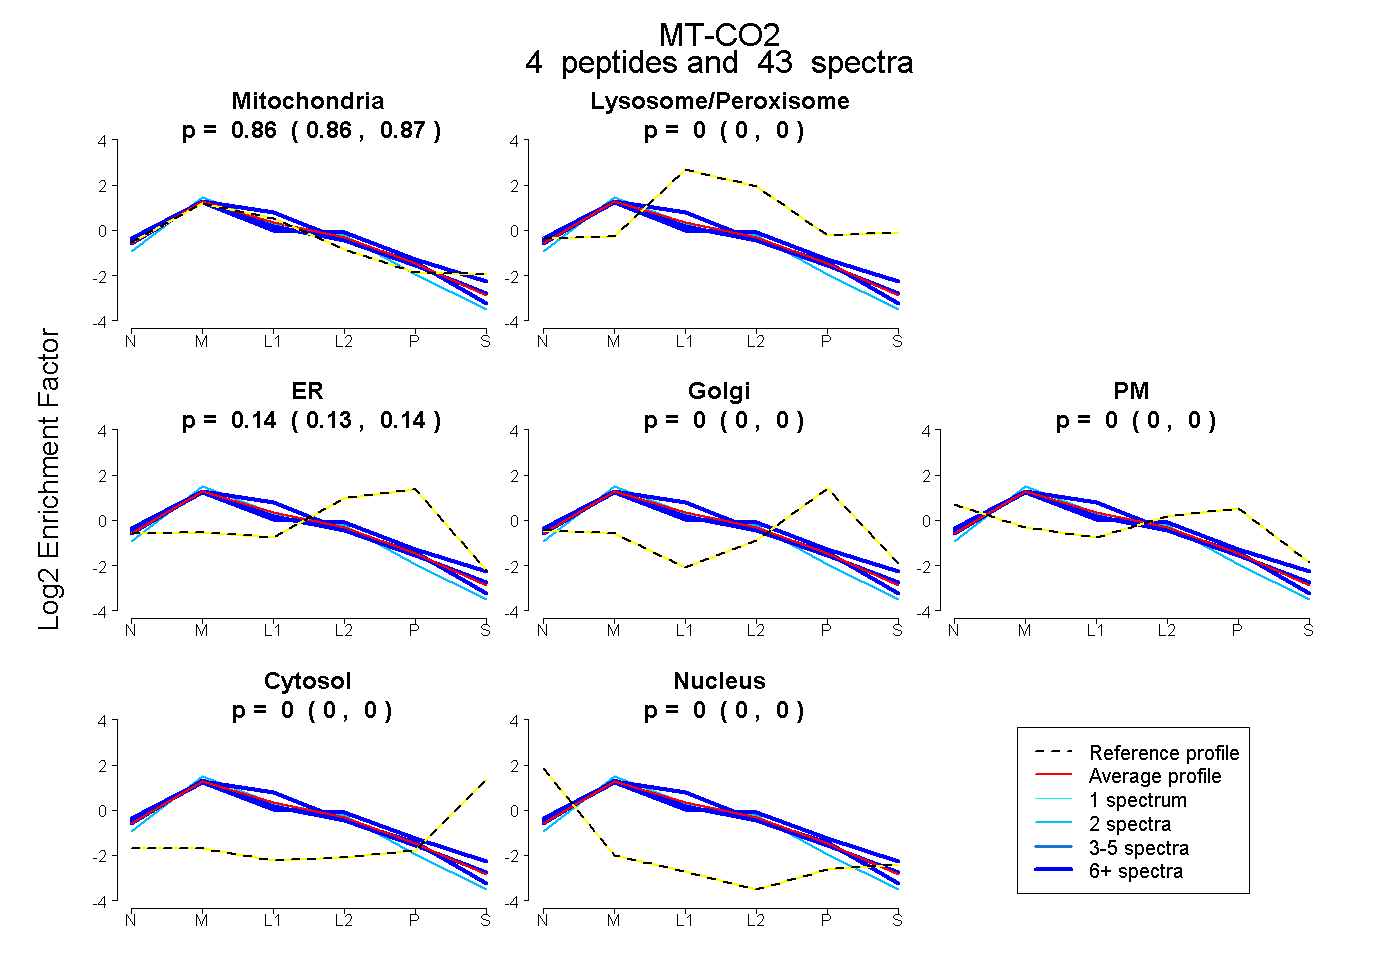
0.855 | 0.868
0.000 | 0.000
0.132 | 0.144
0.000 | 0.000
0.000 | 0.000
0.000 | 0.000
0.000 | 0.000
5peptides
spectra
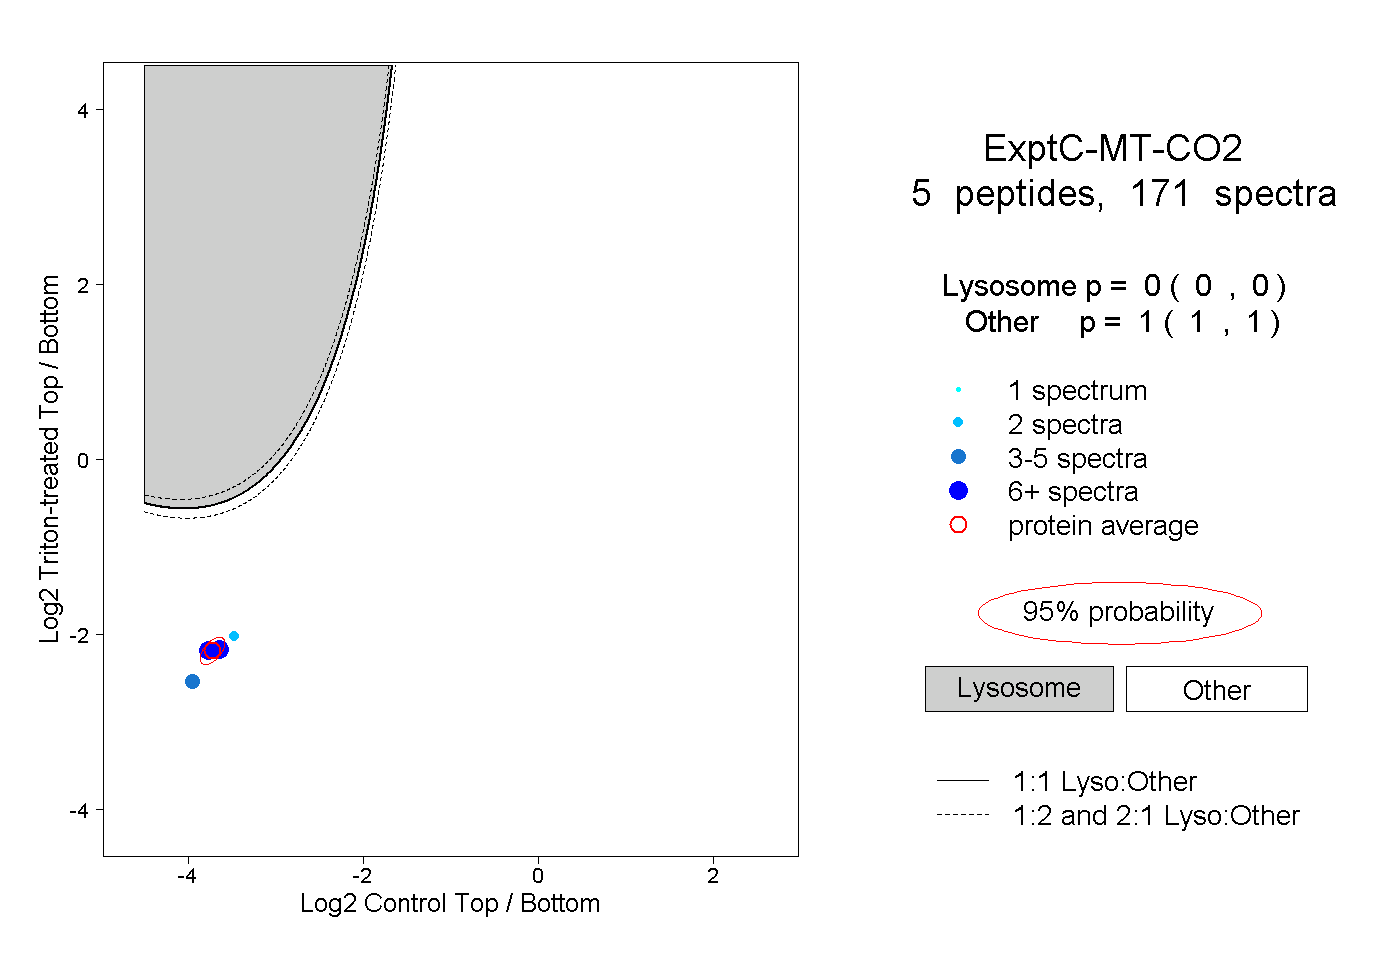
0.000 | 0.000
1.000 | 1.000
2peptides
spectra
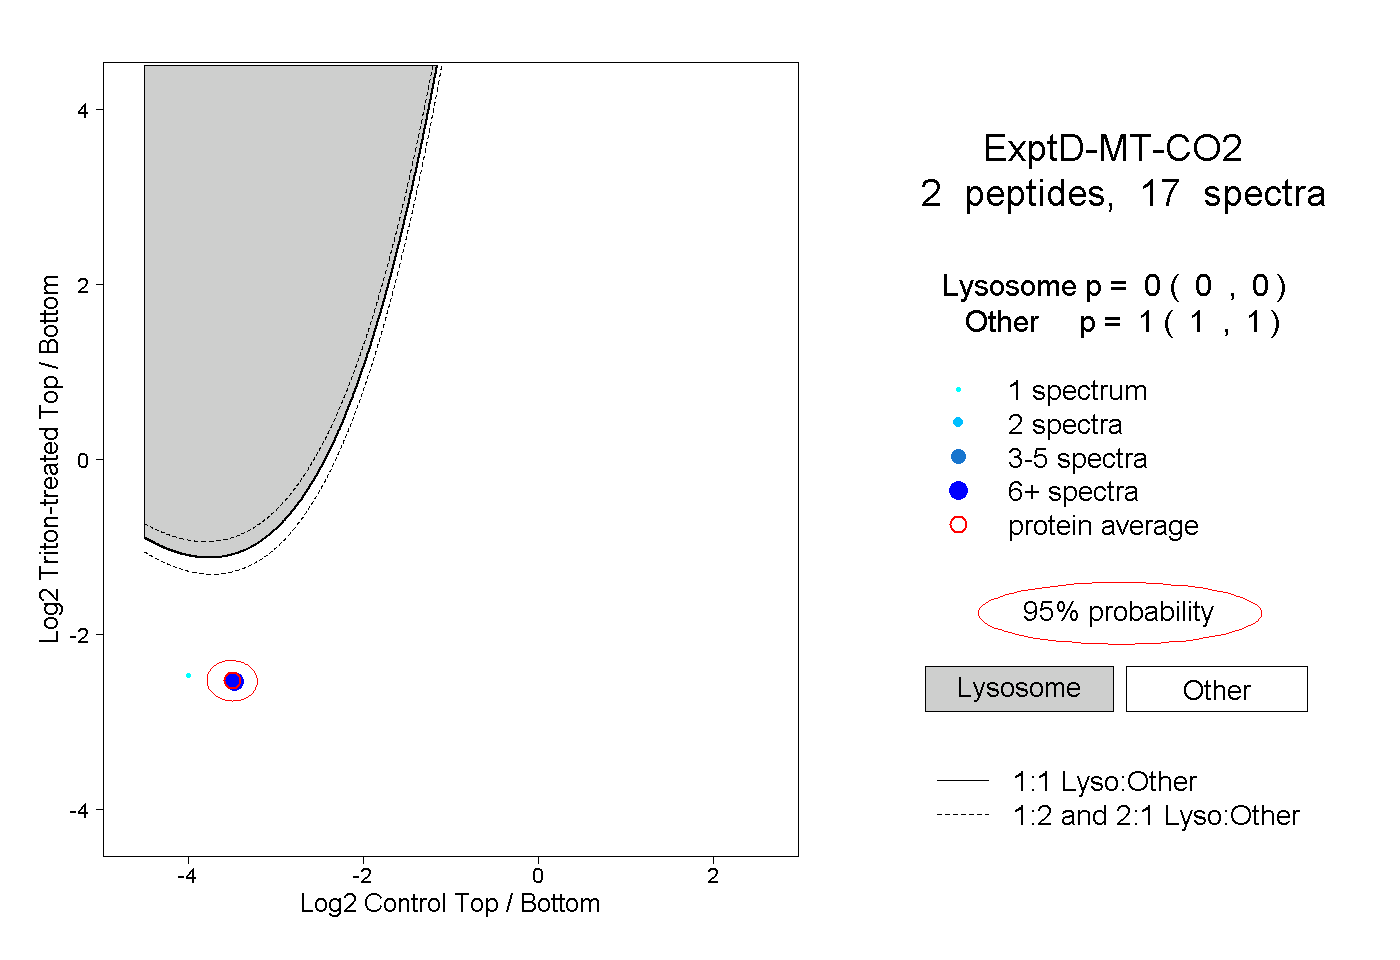
0.000 | 0.000
1.000 | 1.000