 5
5peptides
spectra
0.644 | 0.655
0.092 | 0.104
0.000 | 0.000
0.000 | 0.000
0.000 | 0.000
0.248 | 0.255
0.000 | 0.000
0.000 | 0.000
| Plot | Mito | Lyso | Perox | ER | Golgi | PM | Cytosol | Nucleus | |||||
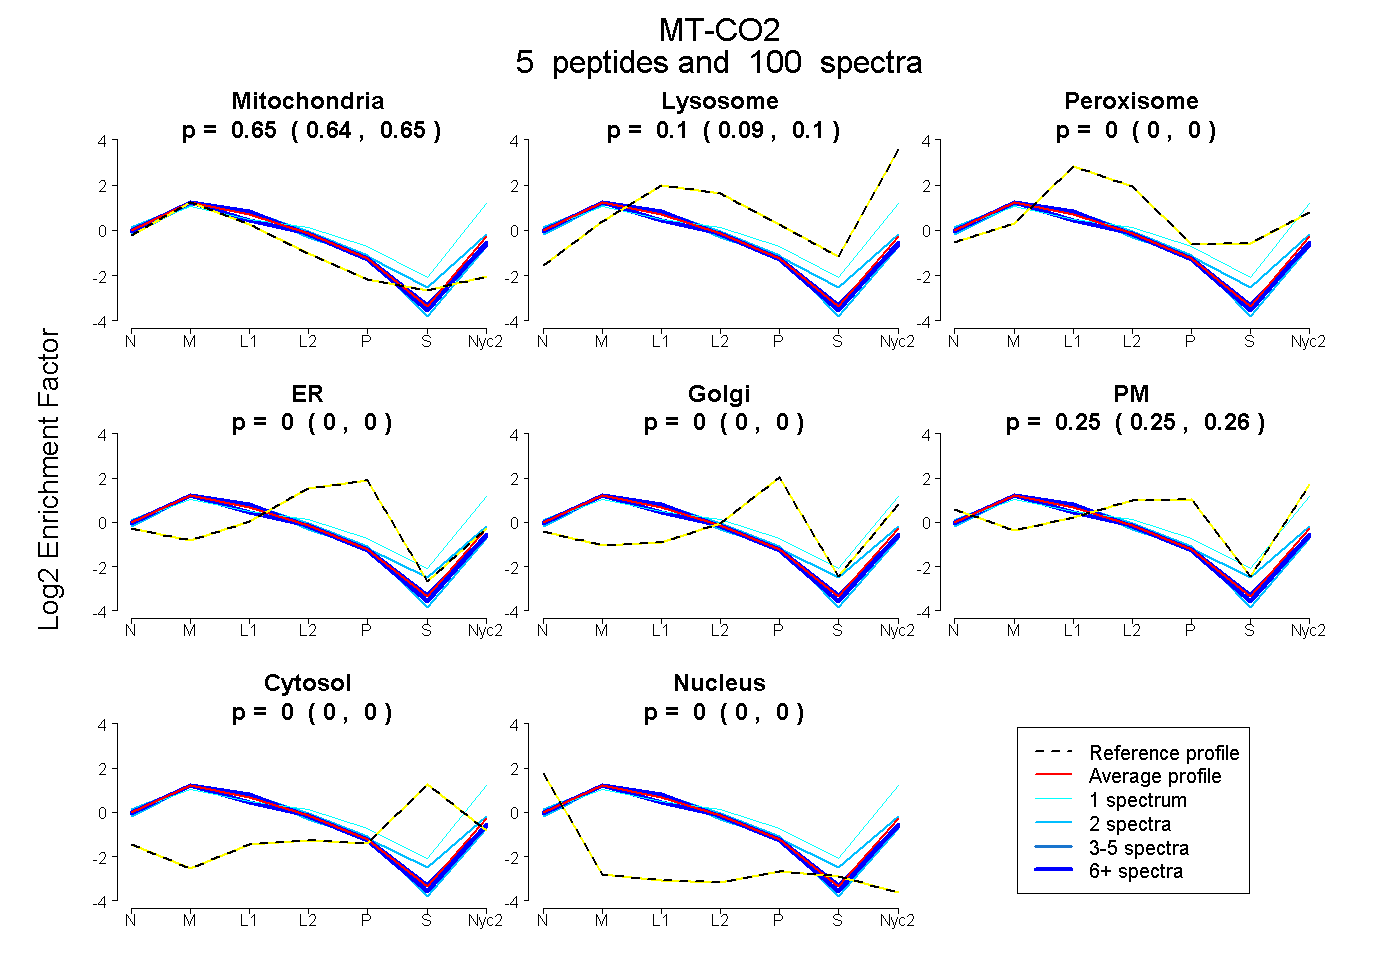
| Expt A |
5 peptides |
100 spectra |
|
0.650 0.644 | 0.655 |
0.099 0.092 | 0.104 |
0.000 0.000 | 0.000 |
0.000 0.000 | 0.000 |
0.000 0.000 | 0.000 |
0.252 0.248 | 0.255 |
0.000 0.000 | 0.000 |
0.000 0.000 | 0.000 |
| 53 spectra, VVLPMELPIR | 0.685 | 0.068 | 0.000 | 0.000 | 0.000 | 0.247 | 0.000 | 0.000 | ||
| 2 spectra, ILYMMDEINNPVLTVK | 0.647 | 0.215 | 0.000 | 0.000 | 0.000 | 0.138 | 0.000 | 0.000 | ||
| 2 spectra, MLISSEDVLHSWAVPSLGLK | 0.673 | 0.000 | 0.000 | 0.000 | 0.000 | 0.327 | 0.000 | 0.000 | ||
| 42 spectra, TDAIPGR | 0.684 | 0.038 | 0.000 | 0.000 | 0.000 | 0.278 | 0.000 | 0.000 | ||
| 1 spectrum, YFENWSASMI | 0.403 | 0.298 | 0.000 | 0.000 | 0.000 | 0.299 | 0.000 | 0.000 |
| Plot | Mito | Lyso or Perox | ER | Golgi | PM | Cytosol | Nucleus | ||||||
| Expt B |
4 peptides |
43 spectra |
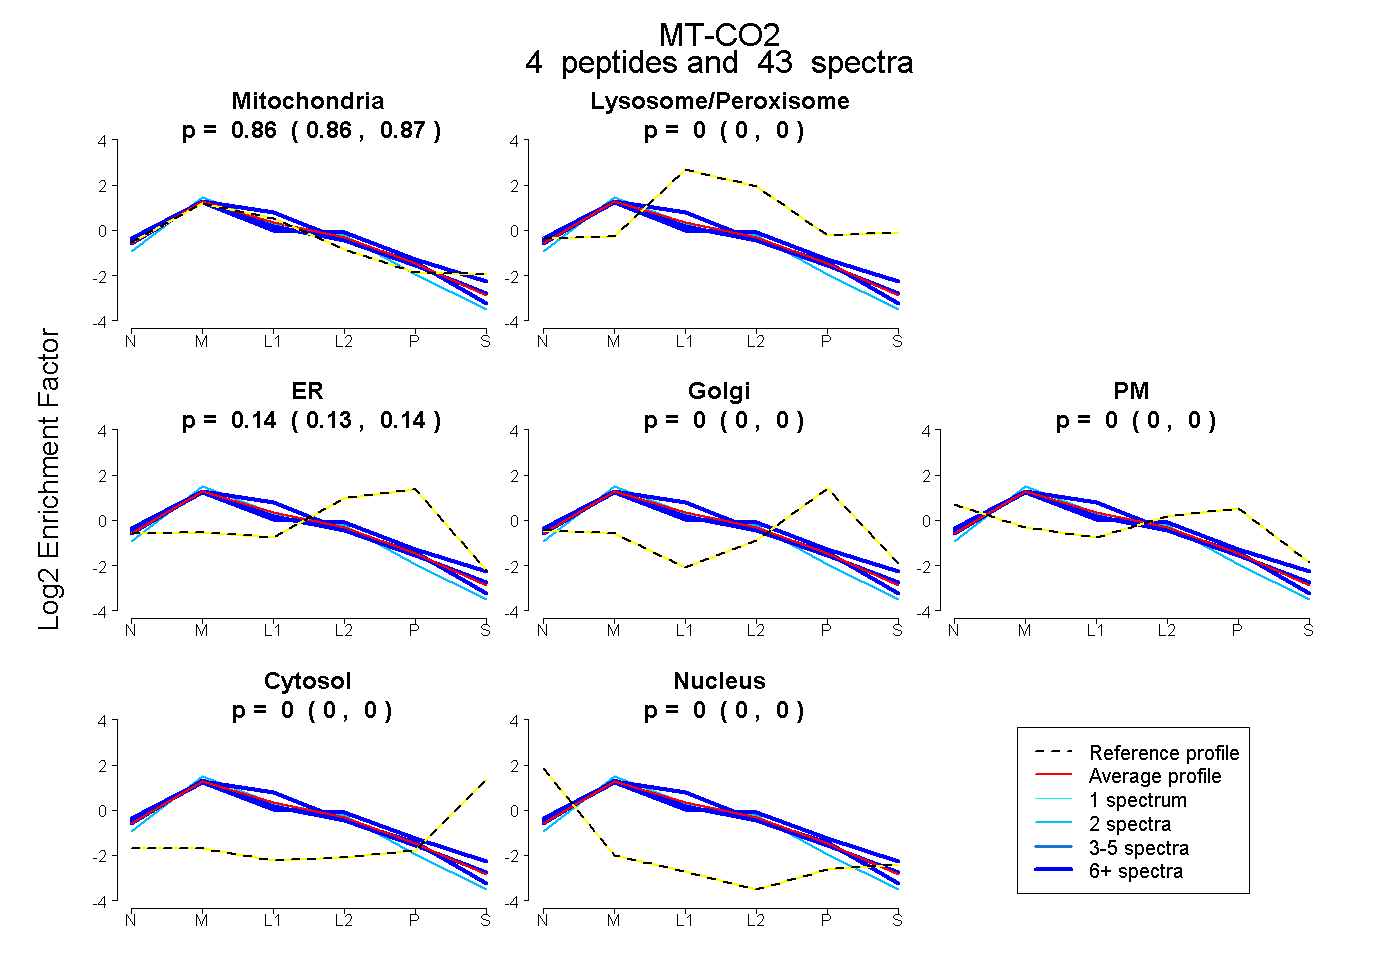 |
0.862 0.855 | 0.868 |
0.000 0.000 | 0.000 |
0.138 0.132 | 0.144 |
0.000 0.000 | 0.000 |
0.000 0.000 | 0.000 |
0.000 0.000 | 0.000 |
0.000 0.000 | 0.000 |
|||
| Plot | Lyso | Other | |||||||||||
| Expt C |
5 peptides |
171 spectra |
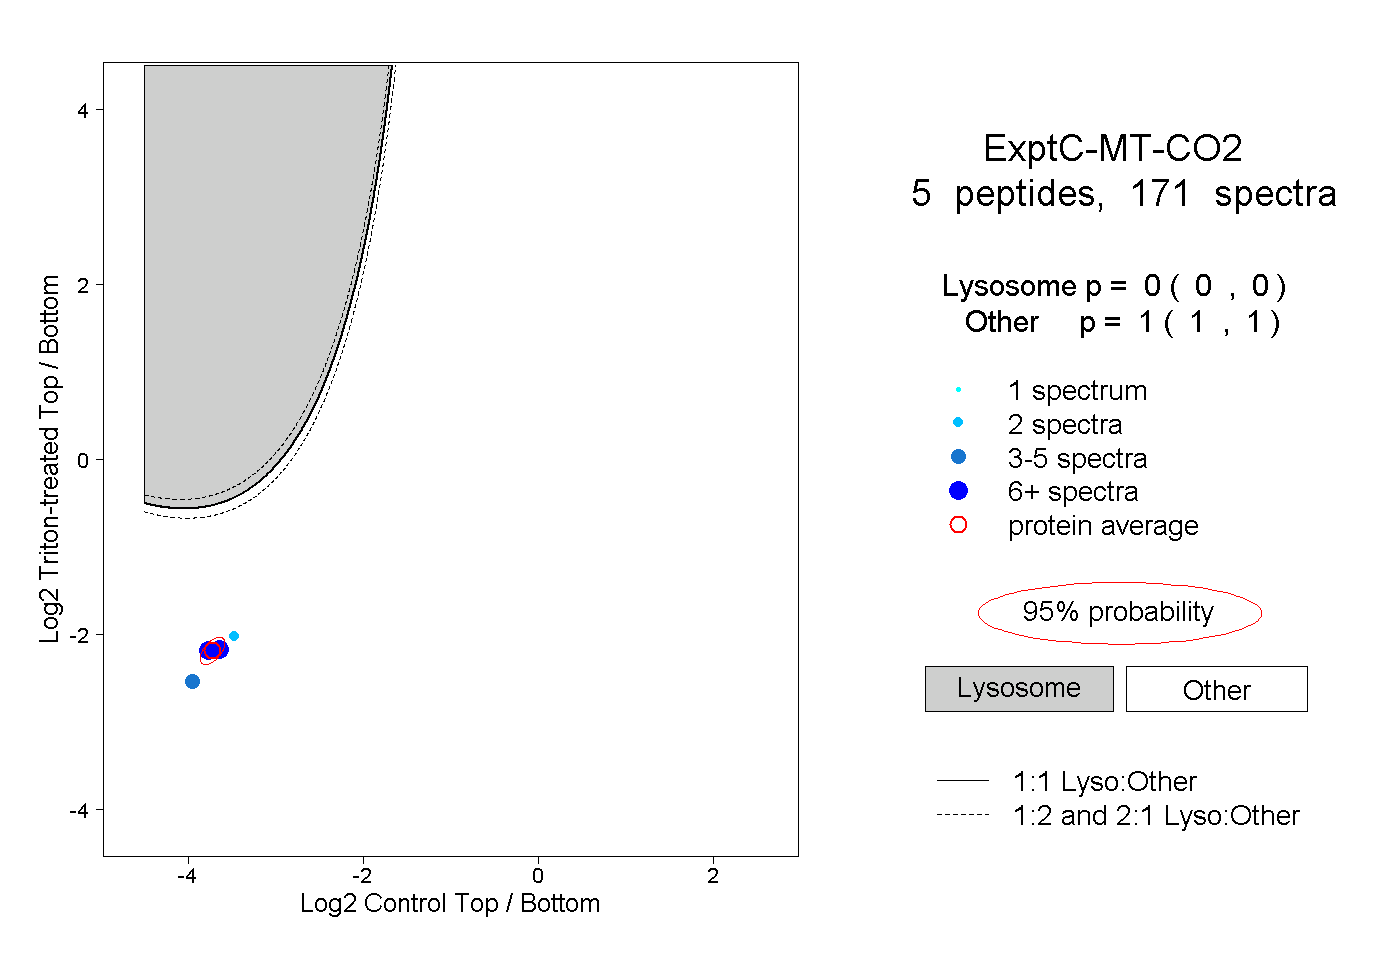 |
0.000 0.000 | 0.000 |
1.000 1.000 | 1.000 |
||||||||
| Plot | Lyso | Other | |||||||||||
| Expt D |
2 peptides |
17 spectra |
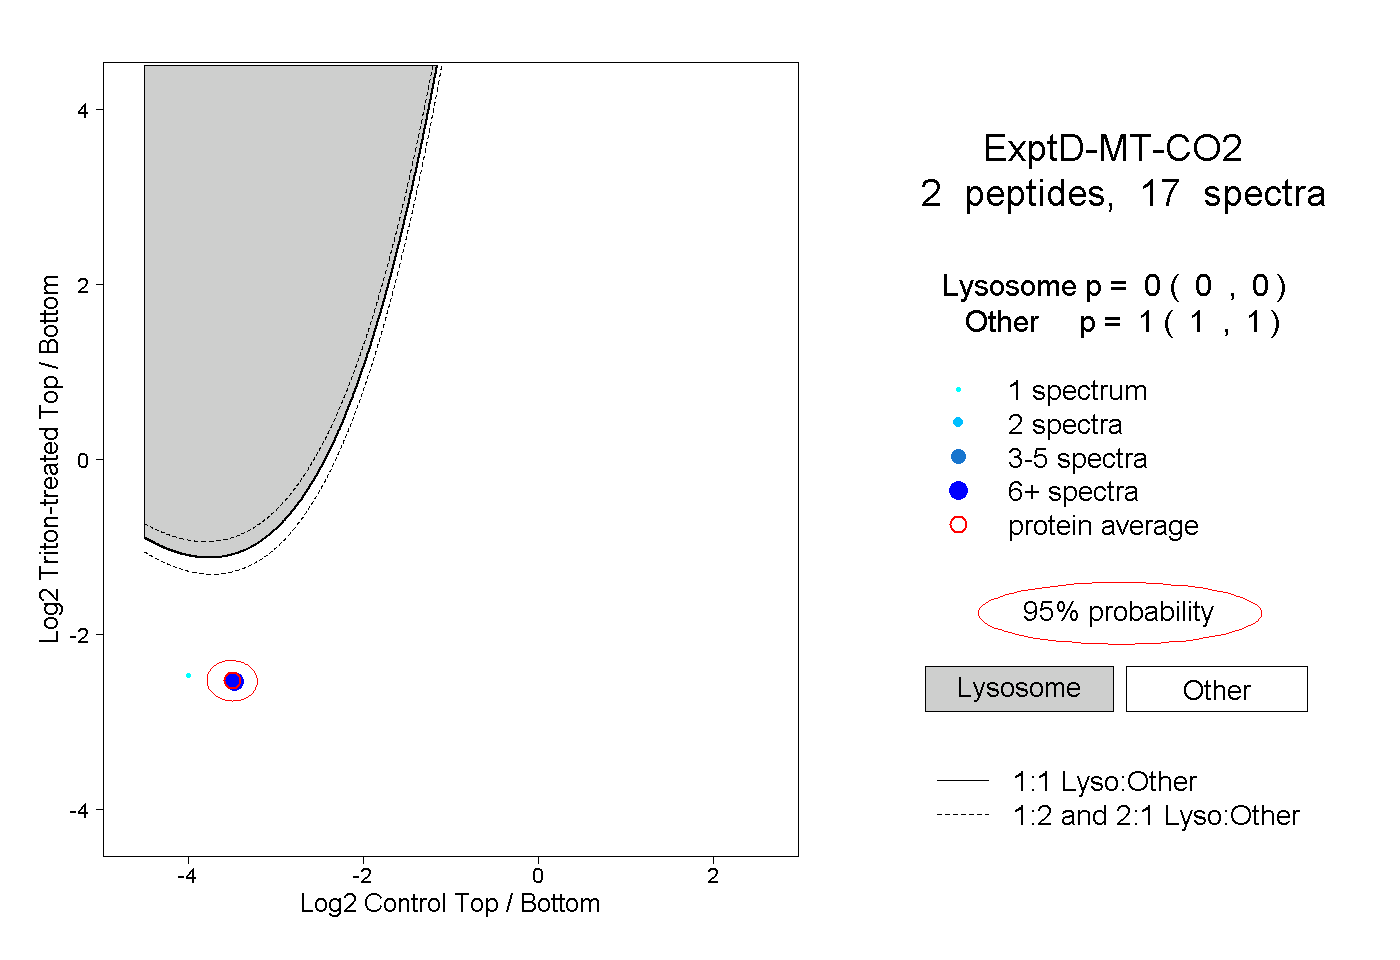 |
0.000 0.000 | 0.000 |
1.000 1.000 | 1.000 |