 6
6peptides
spectra
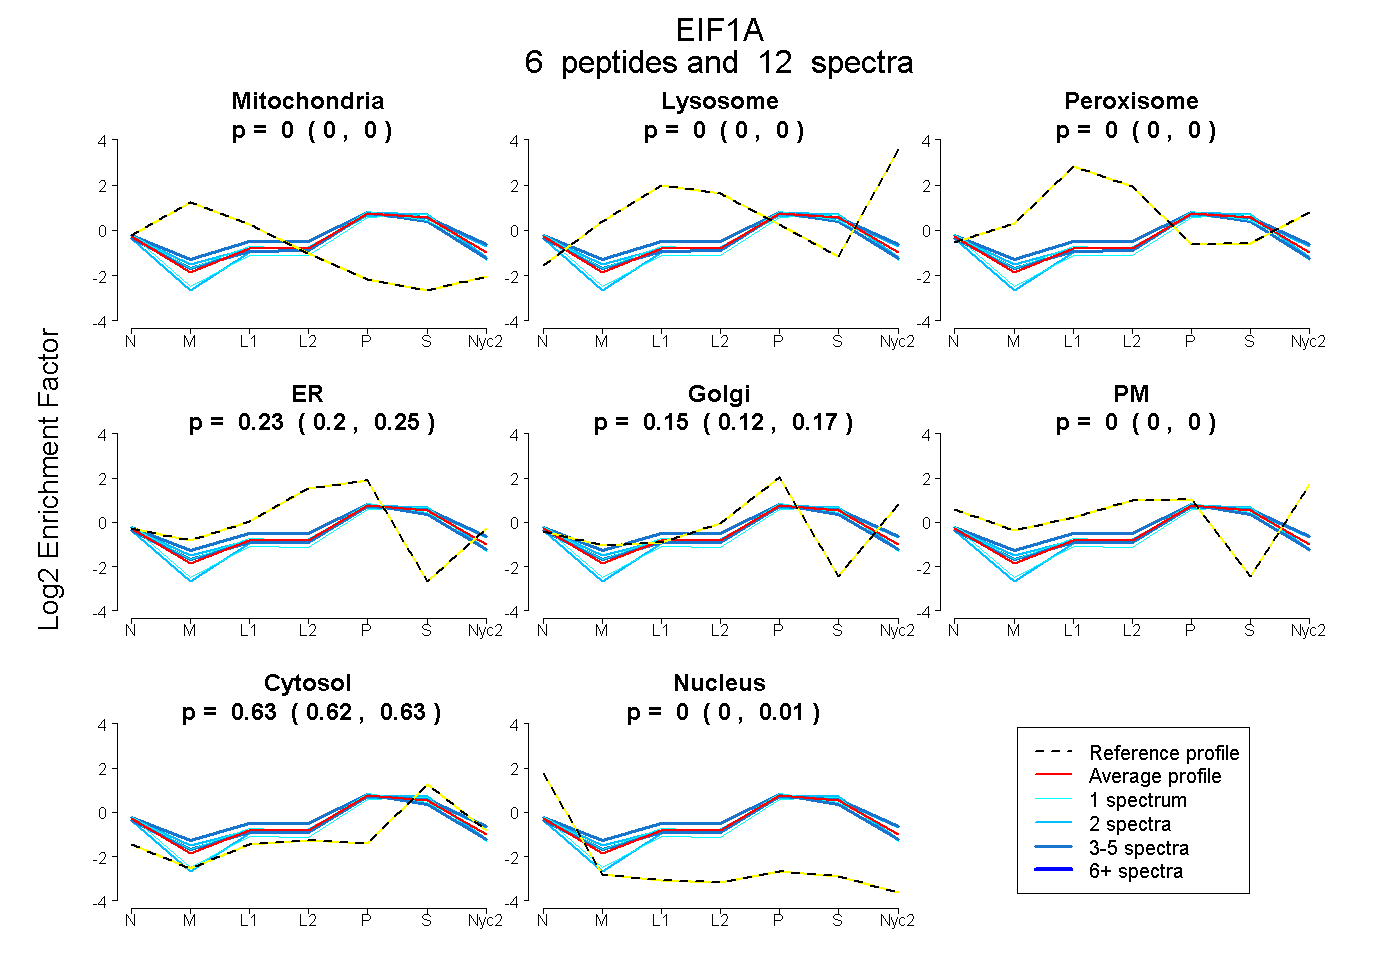
0.000 | 0.000
0.000 | 0.000
0.000 | 0.000
0.201 | 0.246
0.119 | 0.172
0.000 | 0.000
0.618 | 0.631
0.000 | 0.006
5peptides
spectra
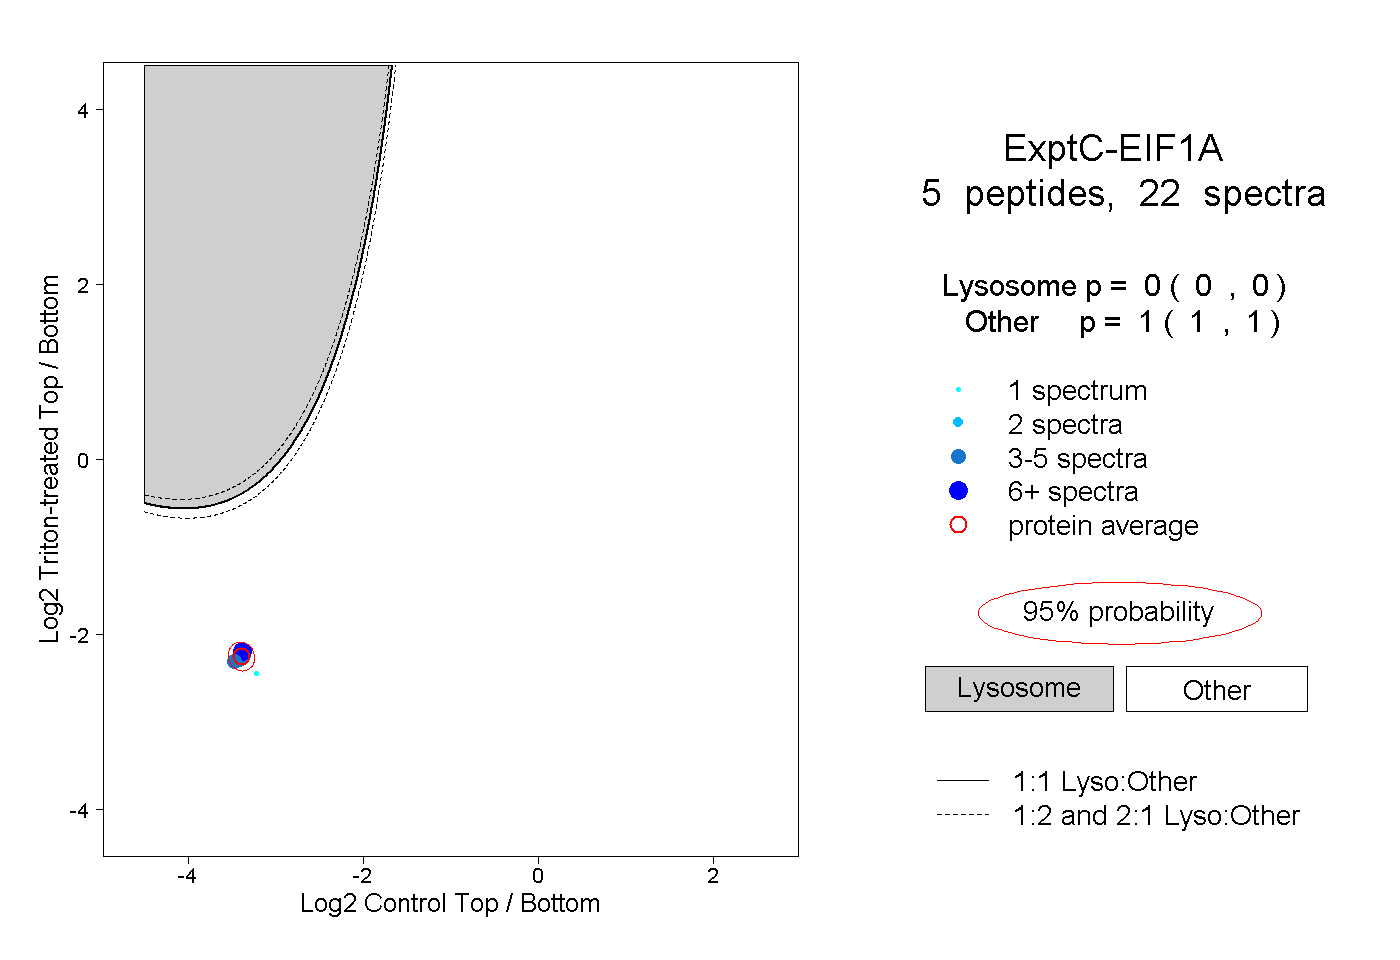
0.000 | 0.000
1.000 | 1.000
1peptide
spectrum
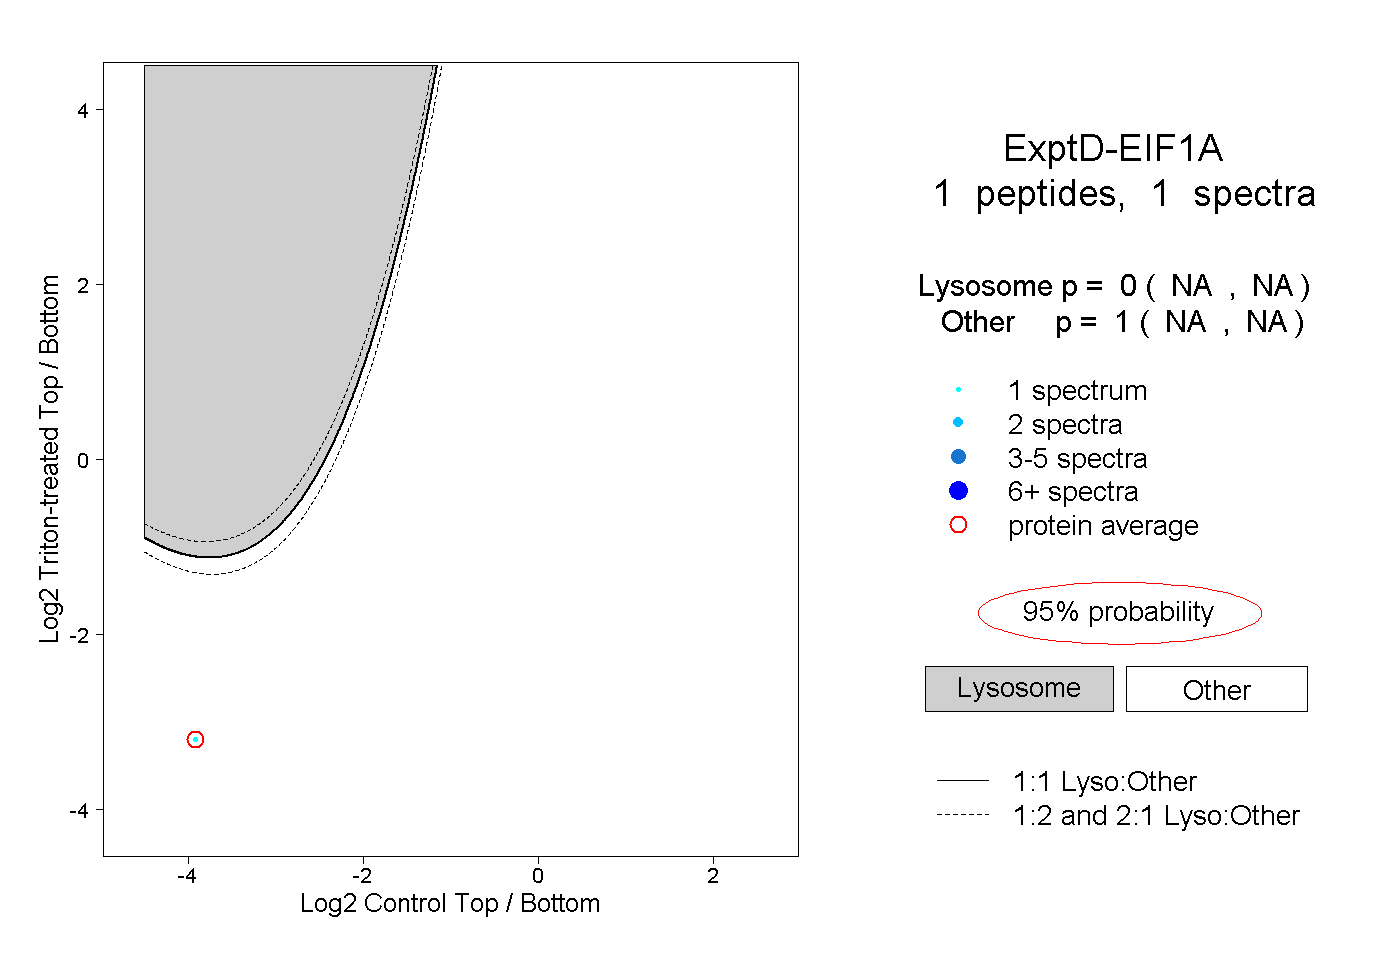
NA | NA
NA | NA