 6
6peptides
spectra
0.000 | 0.000
0.000 | 0.000
0.000 | 0.000
0.201 | 0.246
0.119 | 0.172
0.000 | 0.000
0.618 | 0.631
0.000 | 0.006
| Plot | Mito | Lyso | Perox | ER | Golgi | PM | Cytosol | Nucleus | |||||
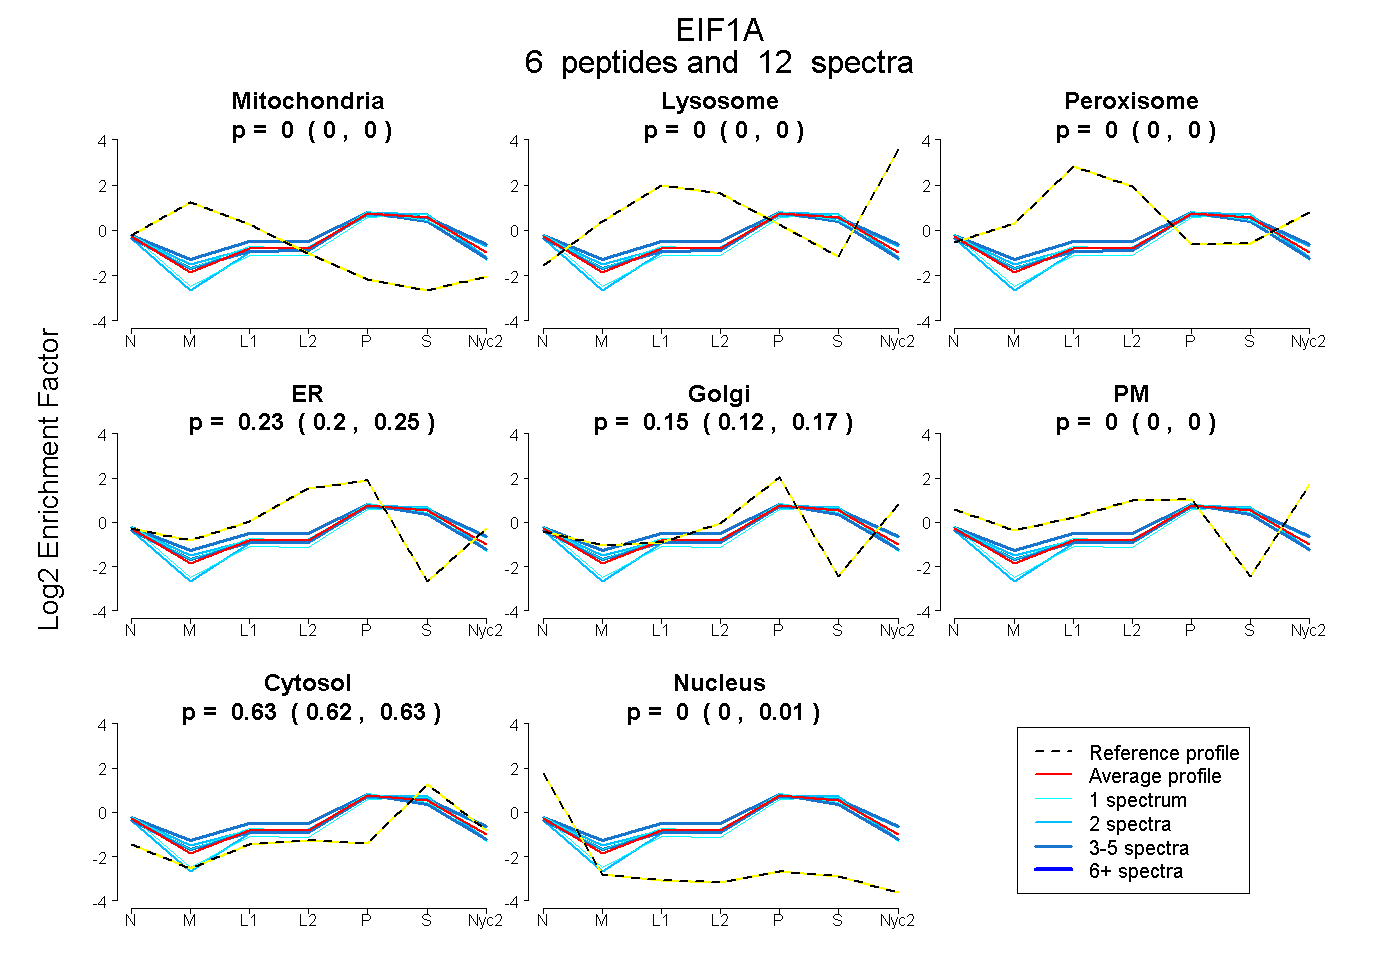
| Expt A |
6 peptides |
12 spectra |
|
0.000 0.000 | 0.000 |
0.000 0.000 | 0.000 |
0.000 0.000 | 0.000 |
0.226 0.201 | 0.246 |
0.147 0.119 | 0.172 |
0.000 0.000 | 0.000 |
0.626 0.618 | 0.631 |
0.000 0.000 | 0.006 |
| 3 spectra, LEAMCFDGVR | 0.010 | 0.000 | 0.000 | 0.424 | 0.000 | 0.000 | 0.566 | 0.000 | ||
| 1 spectrum, YNADEAR | 0.000 | 0.000 | 0.000 | 0.239 | 0.171 | 0.000 | 0.590 | 0.000 | ||
| 2 spectra, ADVILK | 0.000 | 0.000 | 0.026 | 0.154 | 0.234 | 0.000 | 0.587 | 0.000 | ||
| 1 spectrum, EDGQEYAQVIK | 0.000 | 0.000 | 0.000 | 0.145 | 0.132 | 0.000 | 0.663 | 0.061 | ||
| 2 spectra, AYGELPEHAK | 0.000 | 0.000 | 0.000 | 0.200 | 0.104 | 0.000 | 0.678 | 0.018 | ||
| 3 spectra, DYQDNK | 0.000 | 0.000 | 0.000 | 0.096 | 0.299 | 0.000 | 0.605 | 0.000 |
| Plot | Lyso | Other | |||||||||||
| Expt C |
5 peptides |
22 spectra |
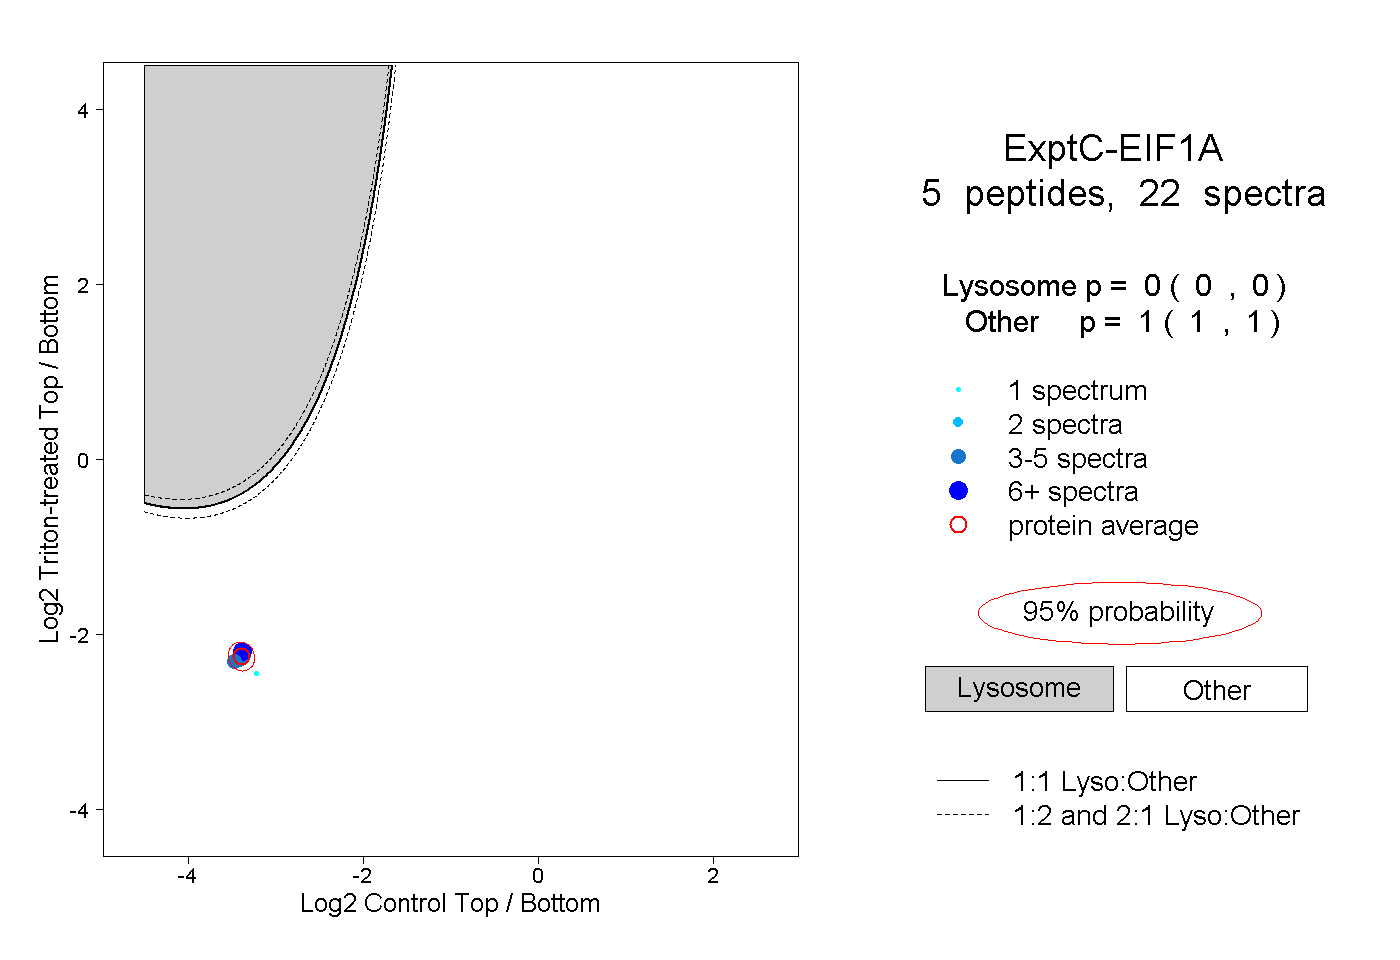 |
0.000 0.000 | 0.000 |
1.000 1.000 | 1.000 |
||||||||
| Plot | Lyso | Other | |||||||||||
| Expt D |
1 peptide |
1 spectrum |
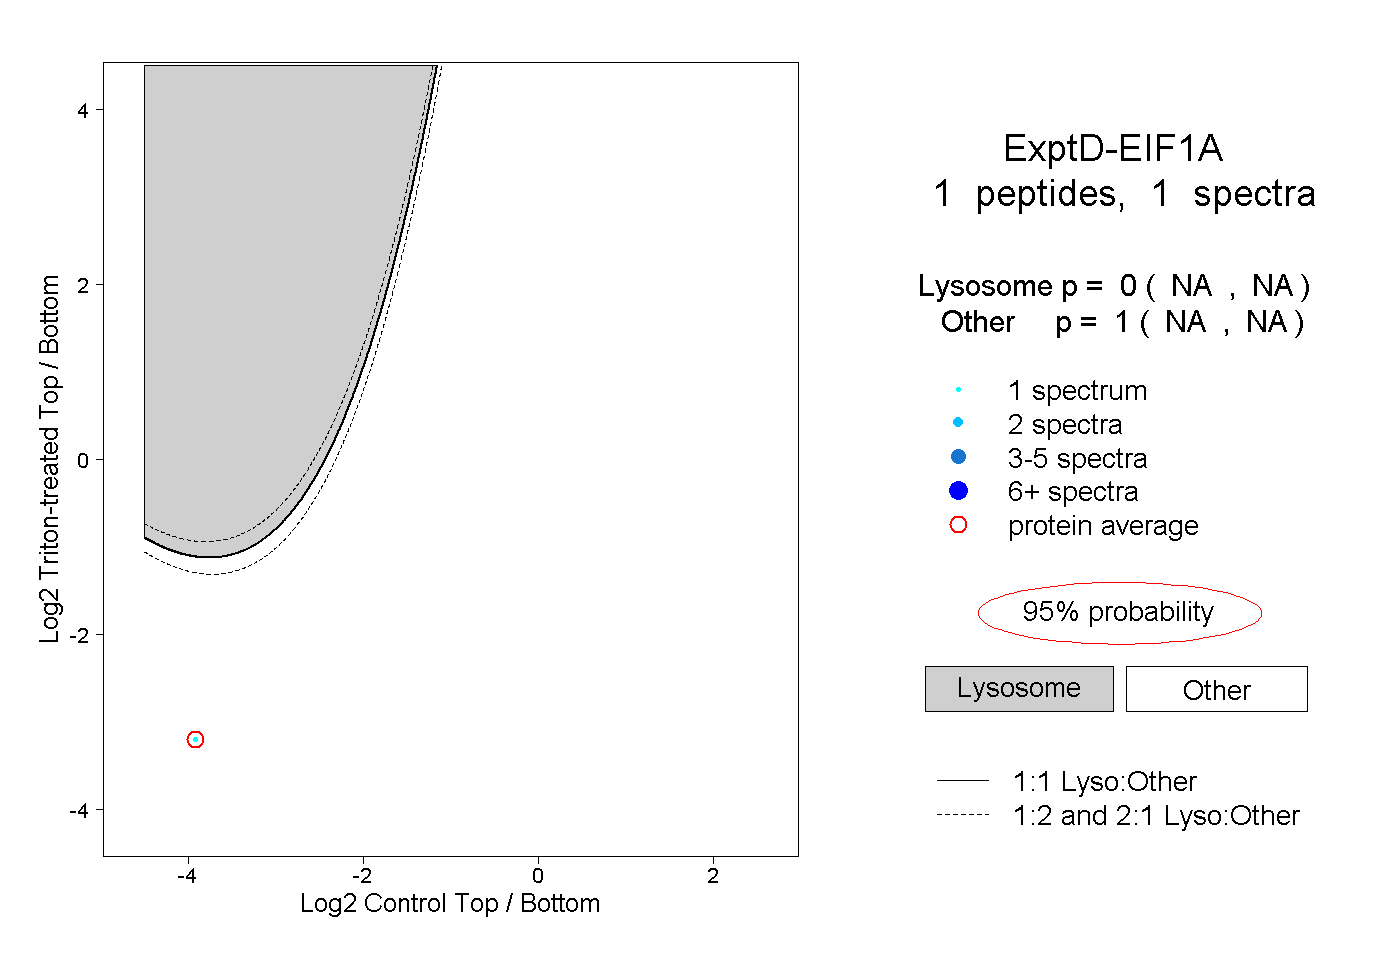 |
0.000 NA | NA |
1.000 NA | NA |