 3
3peptides
spectra
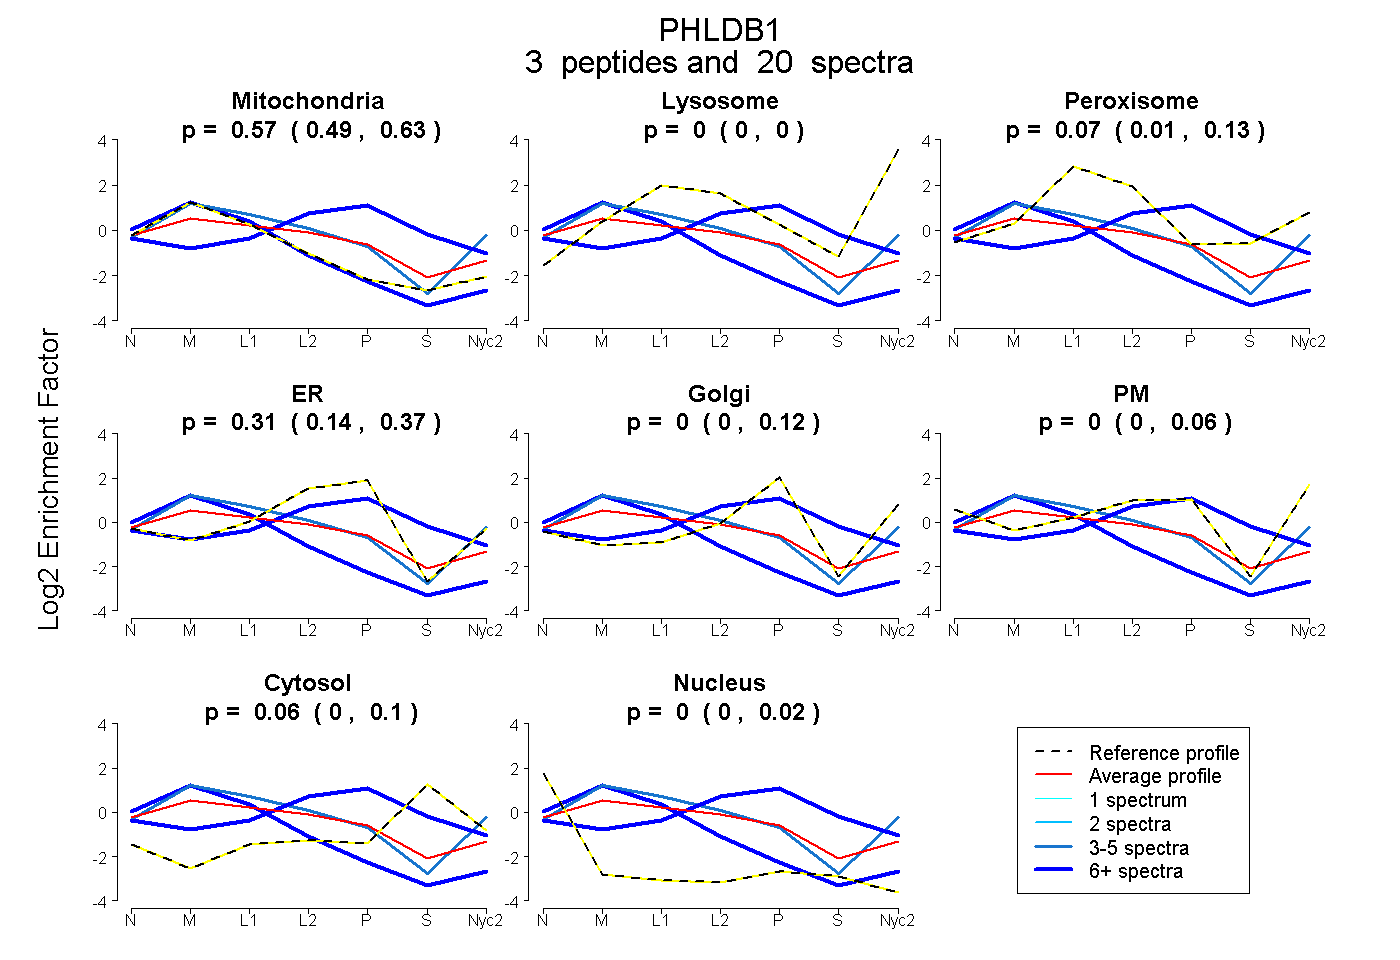
0.494 | 0.633
0.000 | 0.000
0.006 | 0.128
0.136 | 0.365
0.000 | 0.122
0.000 | 0.055
0.000 | 0.104
0.000 | 0.020
1peptide
spectra
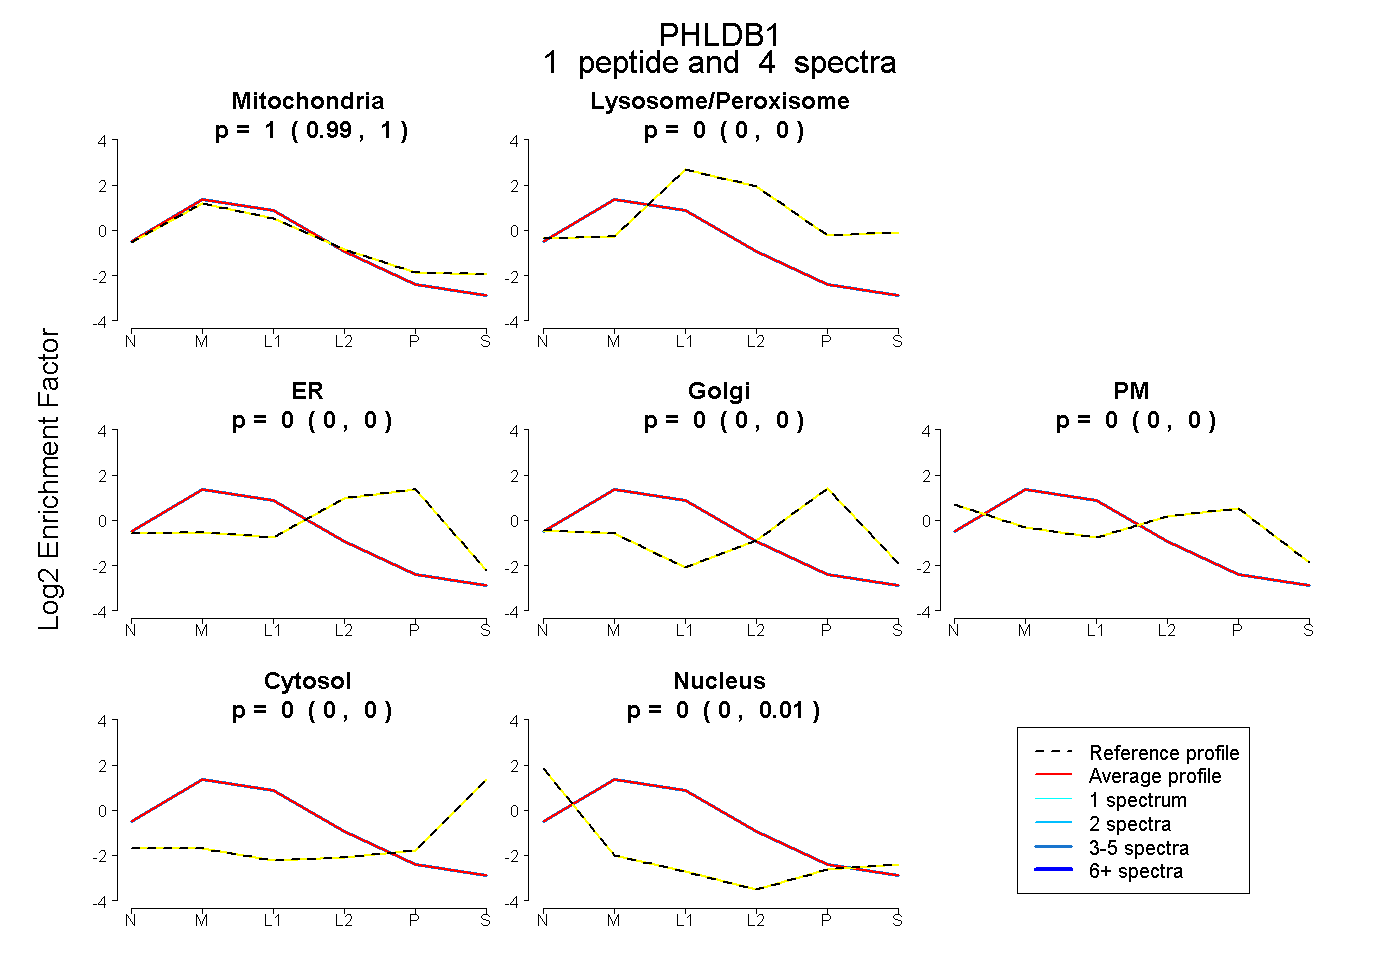
0.989 | 1.000
0.000 | 0.000
0.000 | 0.000
0.000 | 0.000
0.000 | 0.000
0.000 | 0.000
0.000 | 0.006
2peptides
spectra
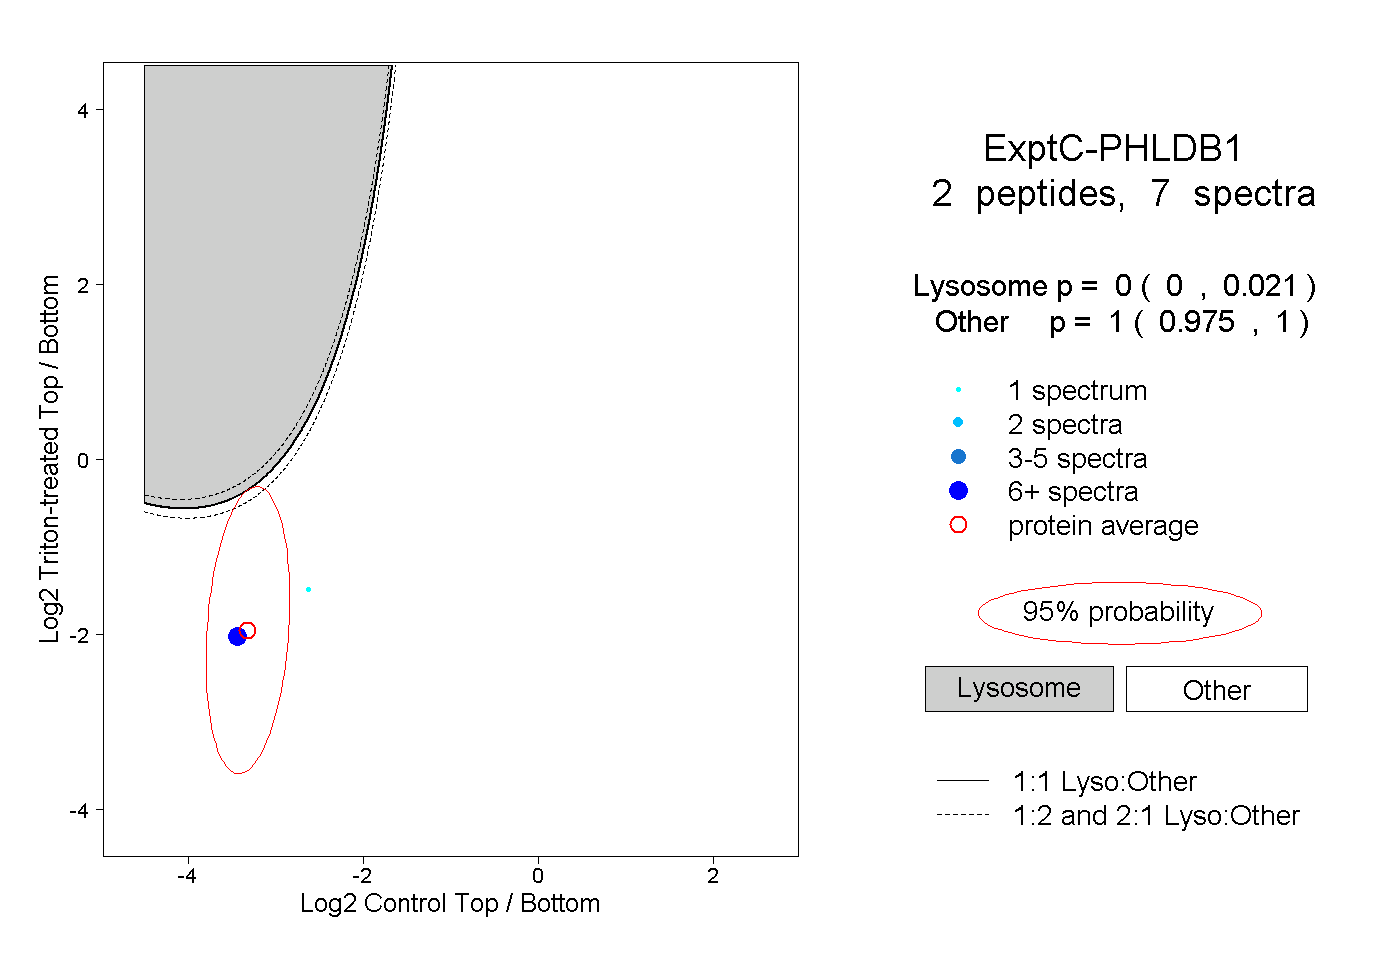
0.000 | 0.021
0.975 | 1.000
3peptides
spectra
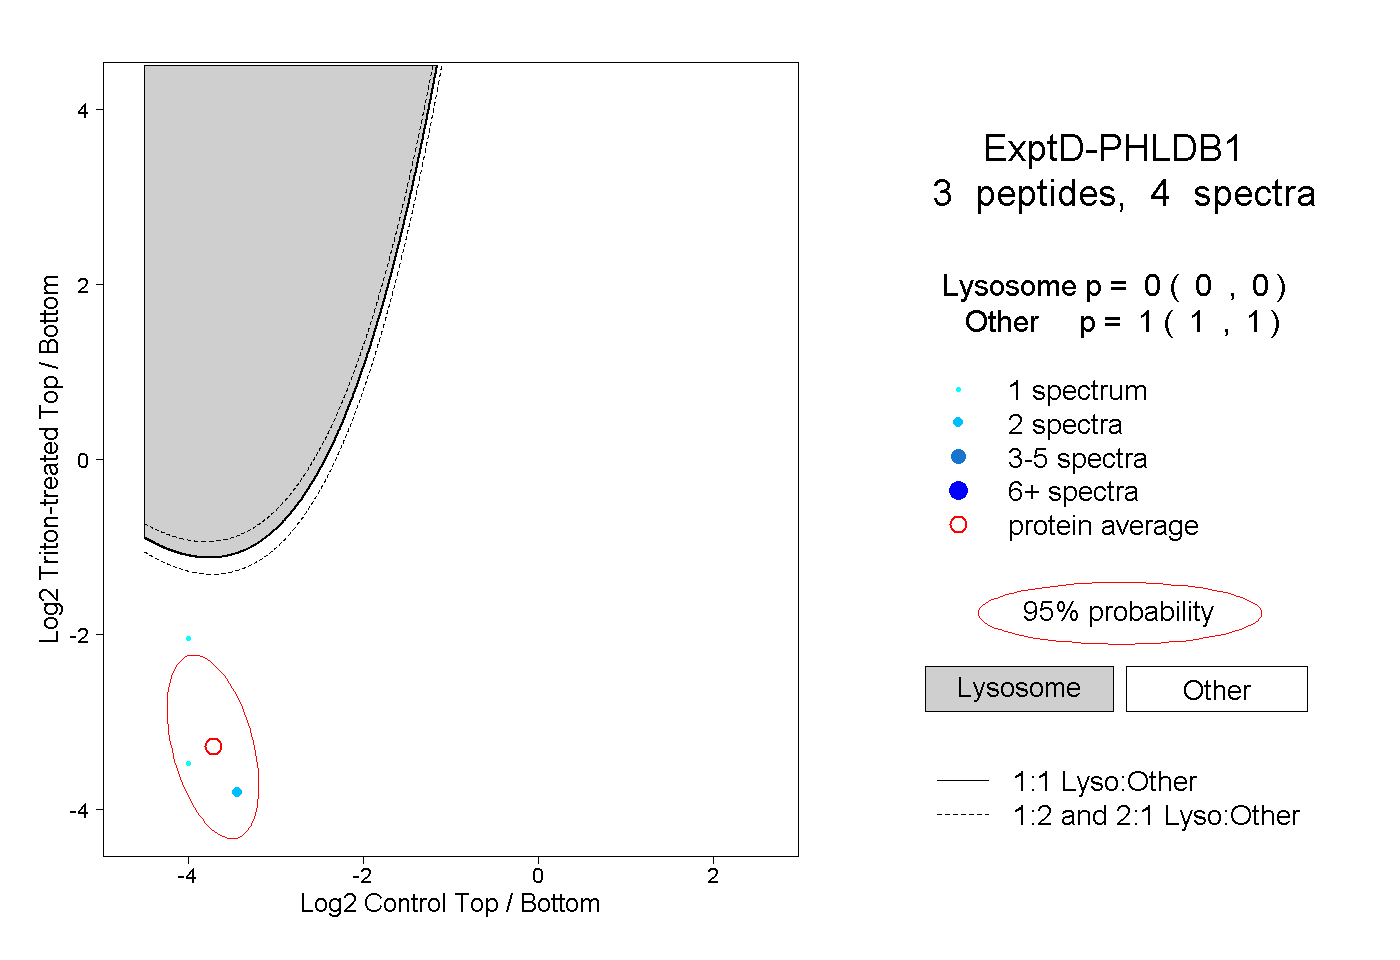
0.000 | 0.000
1.000 | 1.000