 3
3peptides
spectra
0.494 | 0.633
0.000 | 0.000
0.006 | 0.128
0.136 | 0.365
0.000 | 0.122
0.000 | 0.055
0.000 | 0.104
0.000 | 0.020
| Plot | Mito | Lyso | Perox | ER | Golgi | PM | Cytosol | Nucleus | |||||
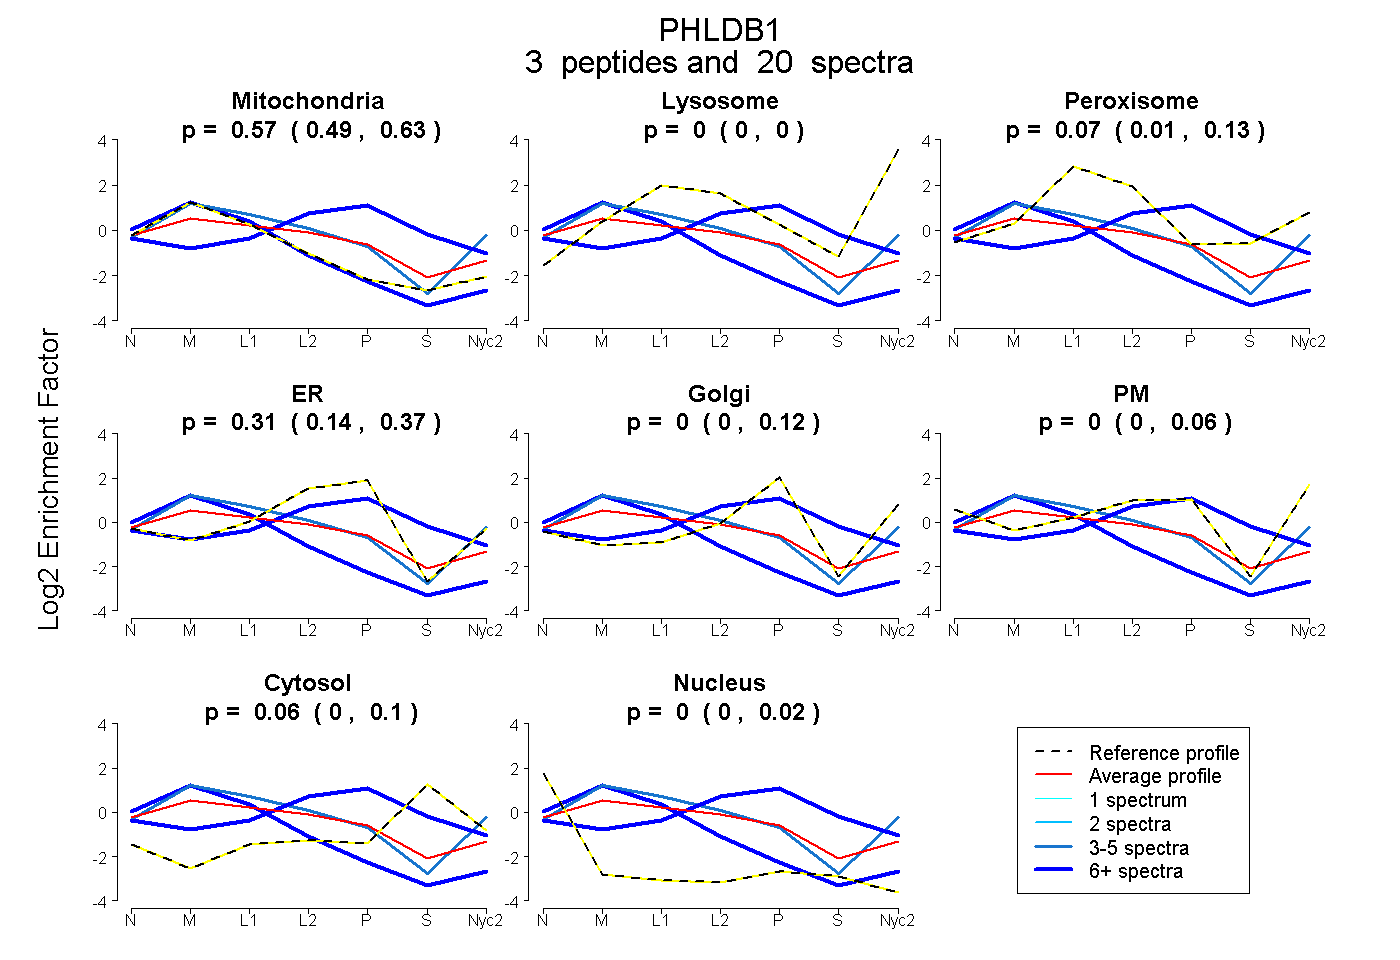
| Expt A |
3 peptides |
20 spectra |
|
0.569 0.494 | 0.633 |
0.000 0.000 | 0.000 |
0.066 0.006 | 0.128 |
0.306 0.136 | 0.365 |
0.001 0.000 | 0.122 |
0.000 0.000 | 0.055 |
0.057 0.000 | 0.104 |
0.000 0.000 | 0.020 |
| 10 spectra, YLPNR | 0.000 | 0.000 | 0.077 | 0.555 | 0.000 | 0.000 | 0.368 | 0.000 | ||
| 7 spectra, ATLNR | 0.960 | 0.000 | 0.000 | 0.000 | 0.000 | 0.000 | 0.000 | 0.040 | ||
| 3 spectra, EMELR | 0.576 | 0.182 | 0.000 | 0.068 | 0.000 | 0.174 | 0.000 | 0.000 |
| Plot | Mito | Lyso or Perox | ER | Golgi | PM | Cytosol | Nucleus | ||||||
| Expt B |
1 peptide |
4 spectra |
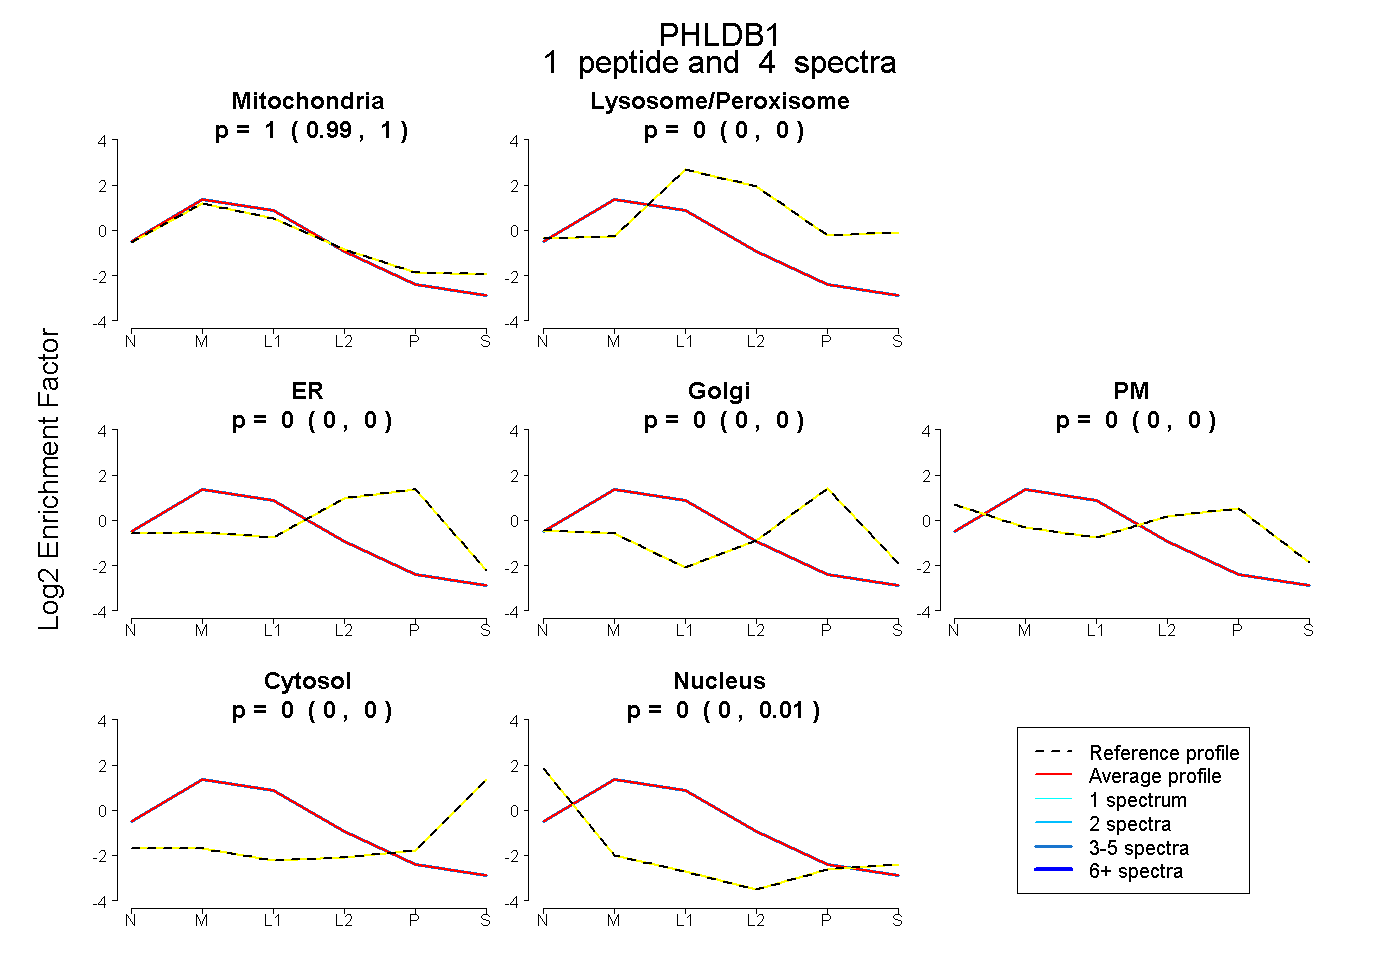 |
1.000 0.989 | 1.000 |
0.000 0.000 | 0.000 |
0.000 0.000 | 0.000 |
0.000 0.000 | 0.000 |
0.000 0.000 | 0.000 |
0.000 0.000 | 0.000 |
0.000 0.000 | 0.006 |
|||
| Plot | Lyso | Other | |||||||||||
| Expt C |
2 peptides |
7 spectra |
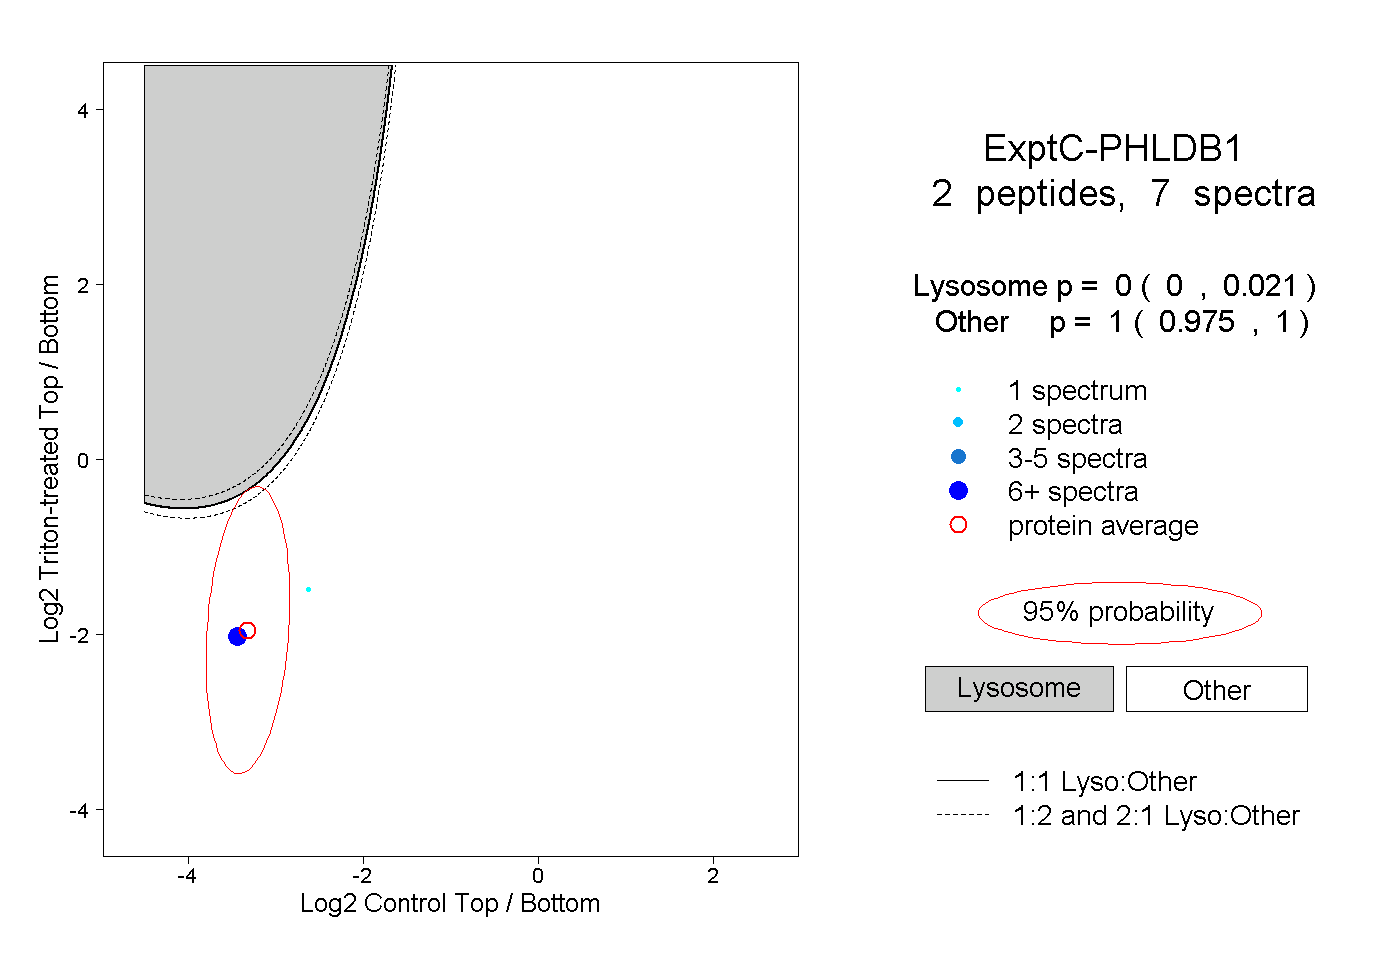 |
0.000 0.000 | 0.021 |
1.000 0.975 | 1.000 |
||||||||
| Plot | Lyso | Other | |||||||||||
| Expt D |
3 peptides |
4 spectra |
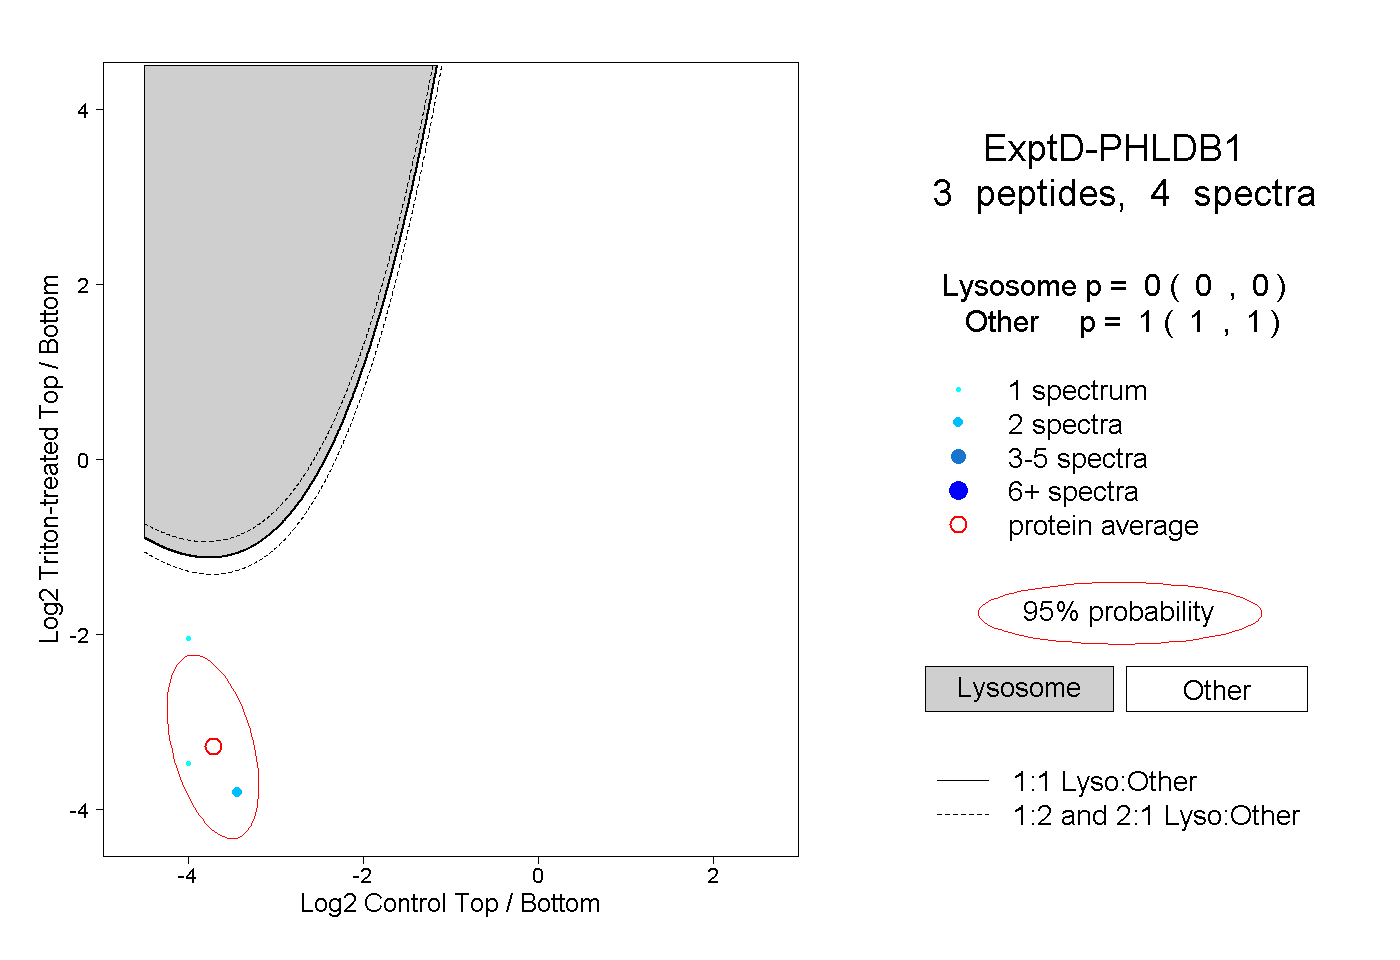 |
0.000 0.000 | 0.000 |
1.000 1.000 | 1.000 |