 4
4peptides
spectra
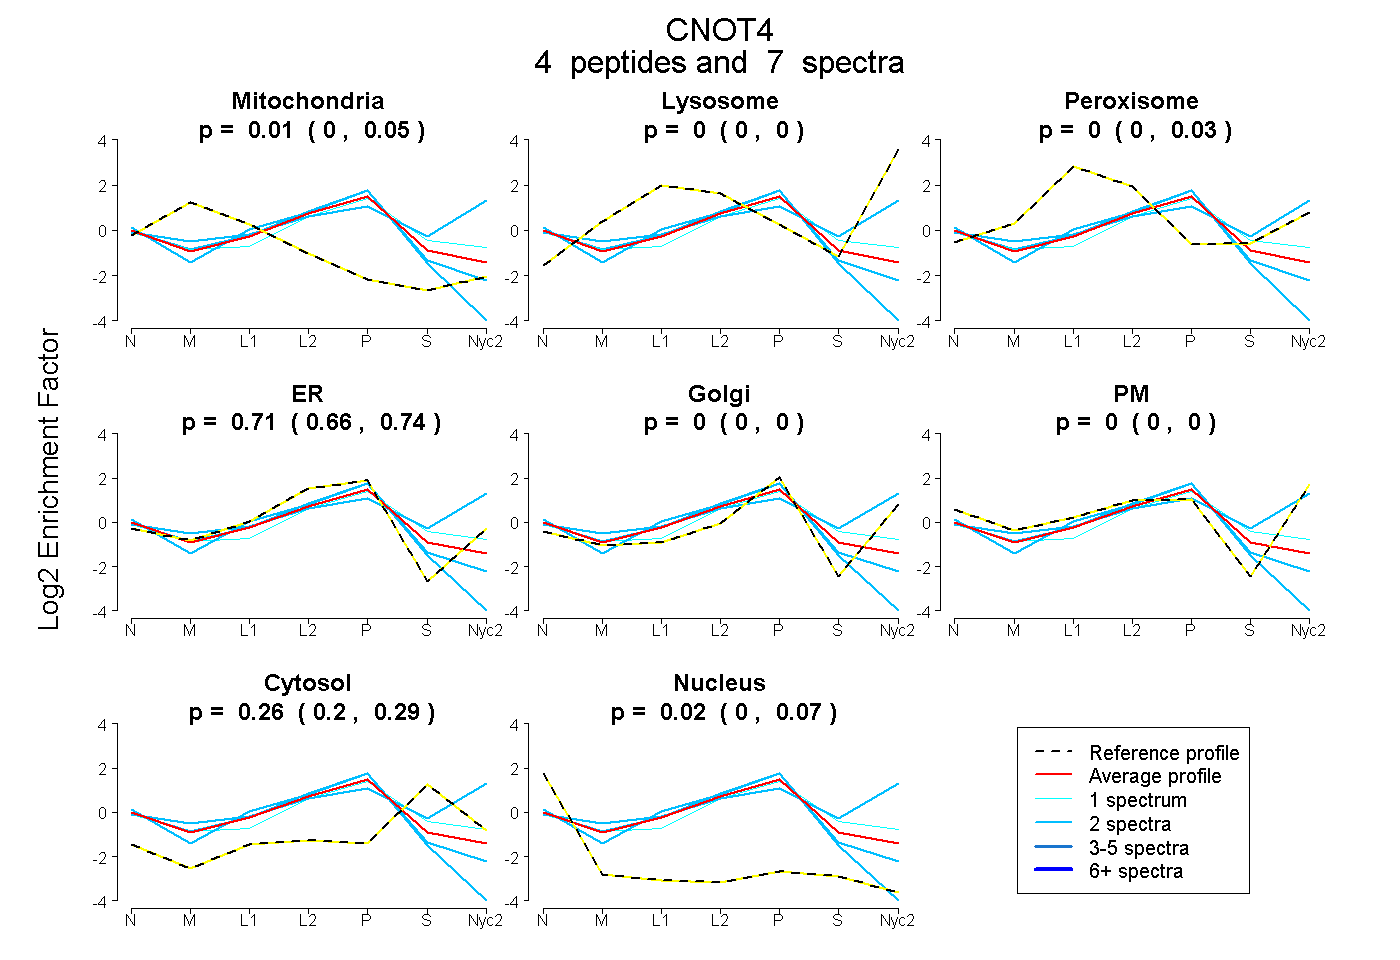
0.000 | 0.045
0.000 | 0.000
0.000 | 0.031
0.663 | 0.736
0.000 | 0.000
0.000 | 0.000
0.196 | 0.288
0.000 | 0.065
2peptides
spectra
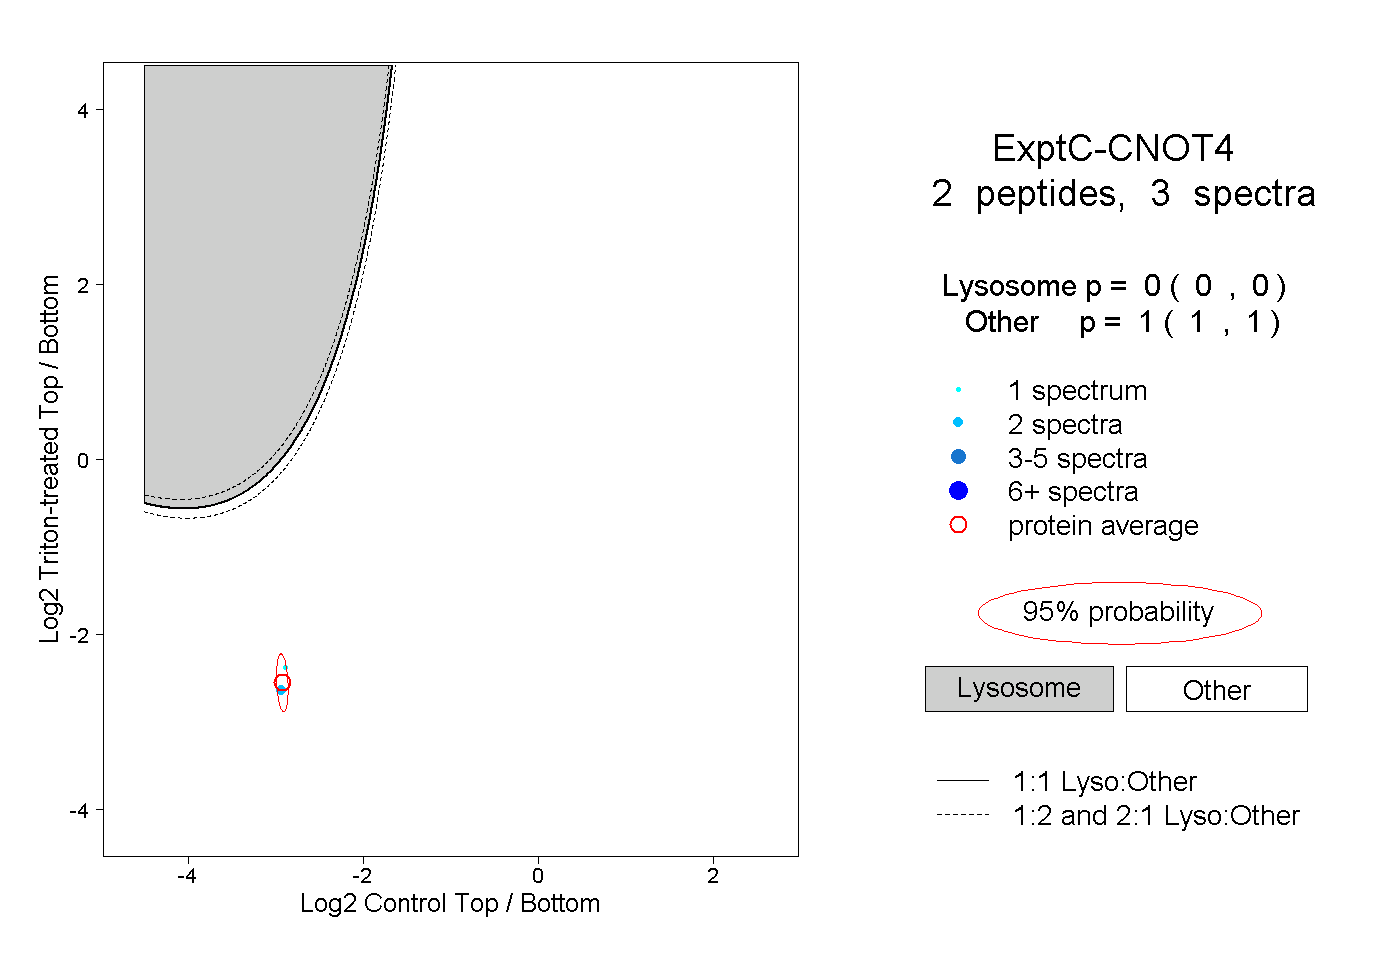
0.000 | 0.000
1.000 | 1.000
1peptide
spectrum
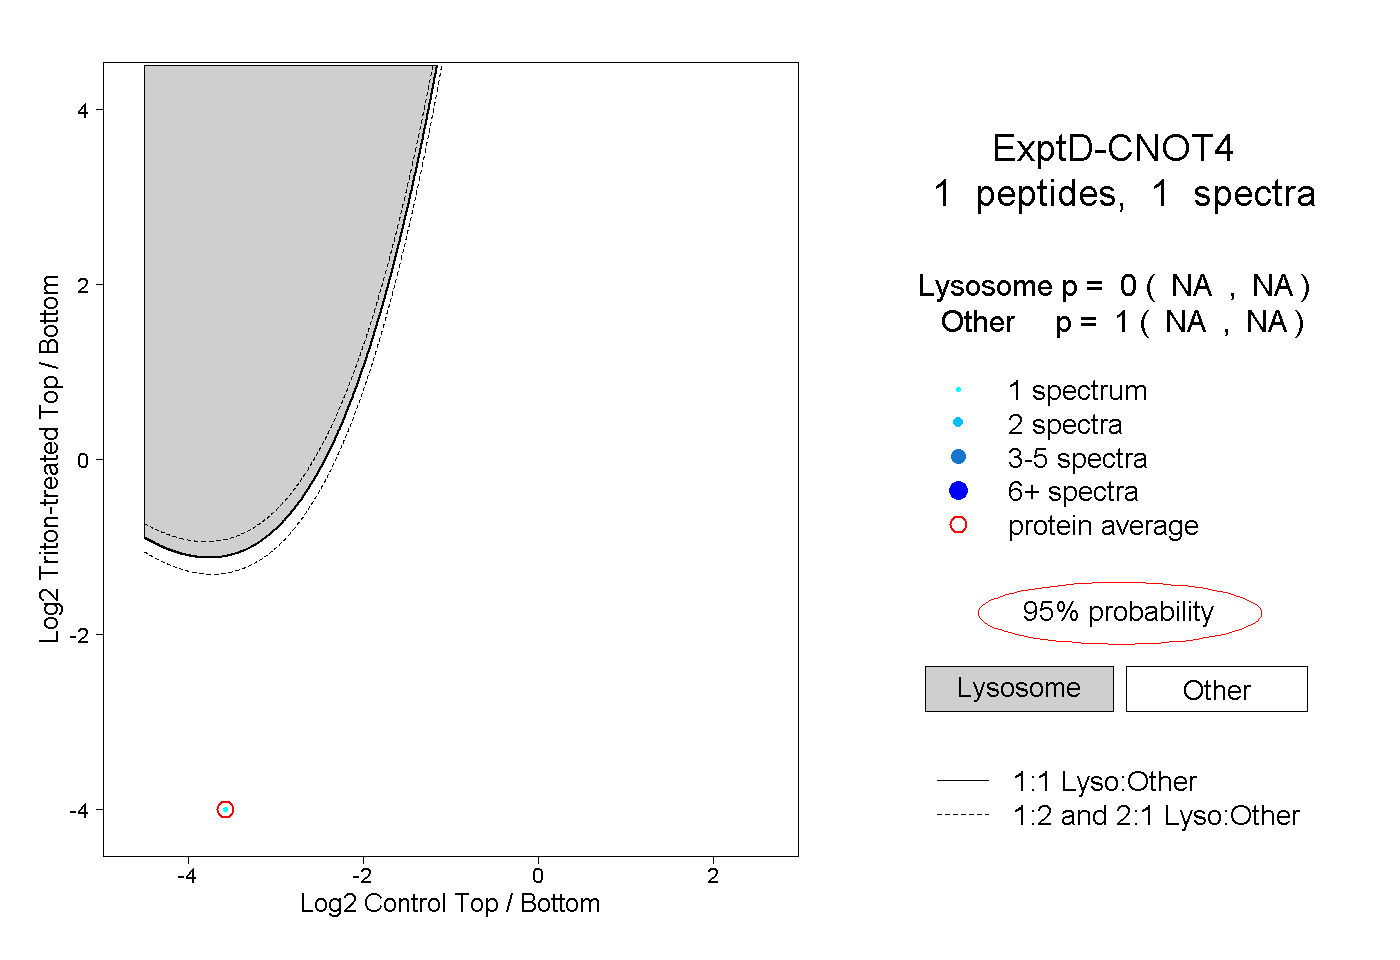
NA | NA
NA | NA