 4
4peptides
spectra
0.000 | 0.045
0.000 | 0.000
0.000 | 0.031
0.663 | 0.736
0.000 | 0.000
0.000 | 0.000
0.196 | 0.288
0.000 | 0.065
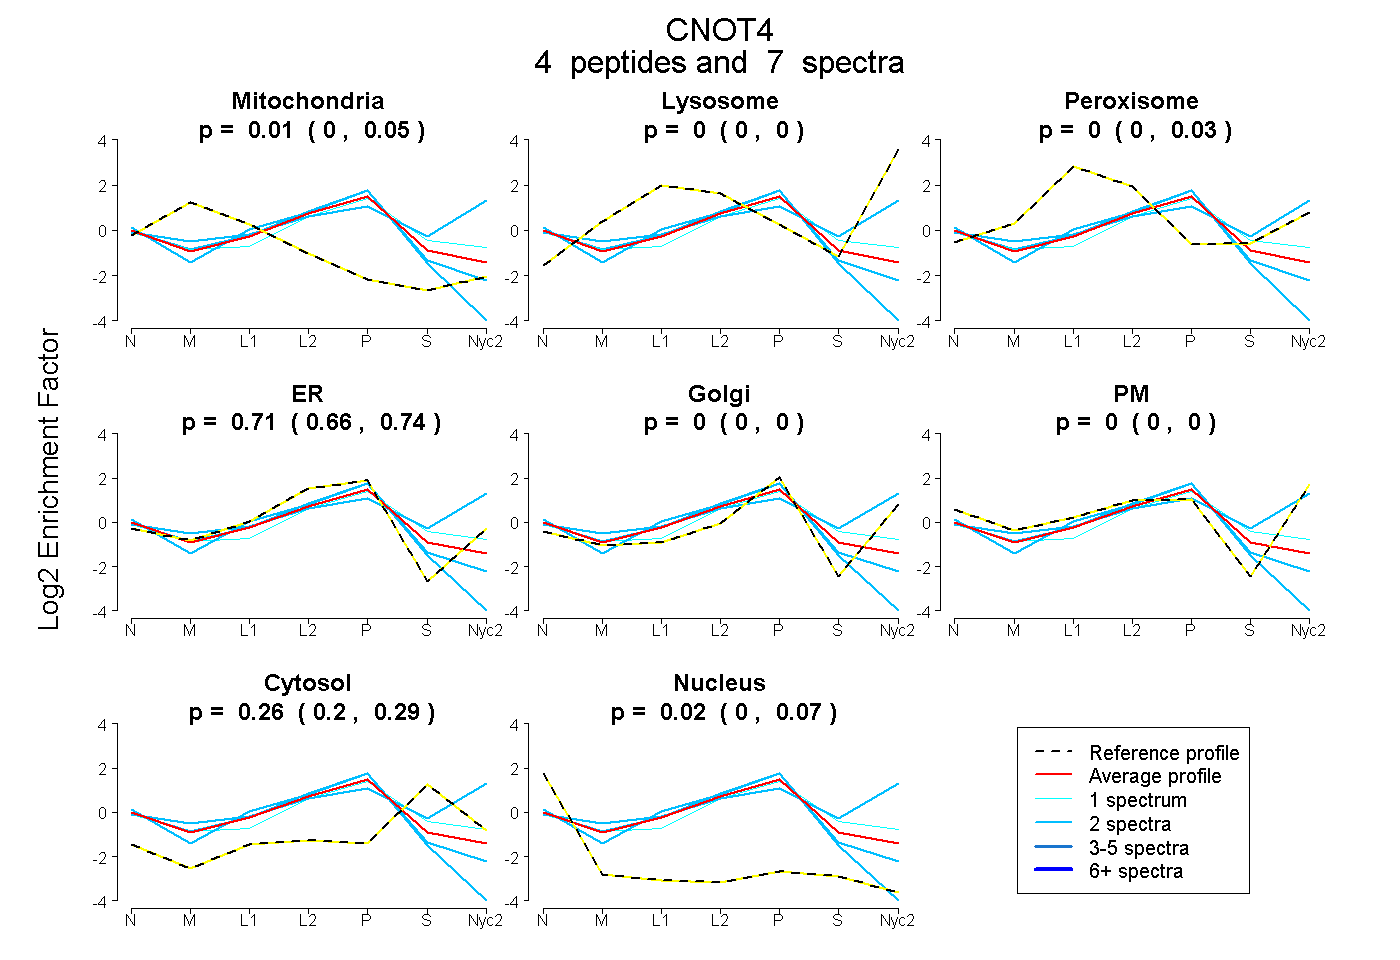
| Plot | Mito | Lyso | Perox | ER | Golgi | PM | Cytosol | Nucleus | |||||
| Expt A |
4 peptides |
7 spectra |
|
0.008 0.000 | 0.045 |
0.000 0.000 | 0.000 |
0.000 0.000 | 0.031 |
0.713 0.663 | 0.736 |
0.000 0.000 | 0.000 |
0.000 0.000 | 0.000 |
0.257 0.196 | 0.288 |
0.021 0.000 | 0.065 |
| 2 spectra, YCSYFLK | 0.000 | 0.191 | 0.032 | 0.000 | 0.156 | 0.372 | 0.249 | 0.000 | ||
| 1 spectrum, HQEYEQK | 0.000 | 0.000 | 0.000 | 0.652 | 0.000 | 0.000 | 0.348 | 0.000 | ||
| 2 spectra, AIQCVNNVVVDGR | 0.009 | 0.000 | 0.000 | 0.765 | 0.000 | 0.000 | 0.134 | 0.092 | ||
| 2 spectra, LADPEVLK | 0.000 | 0.000 | 0.000 | 0.723 | 0.000 | 0.000 | 0.036 | 0.242 |
| Plot | Lyso | Other | |||||||||||
| Expt C |
2 peptides |
3 spectra |
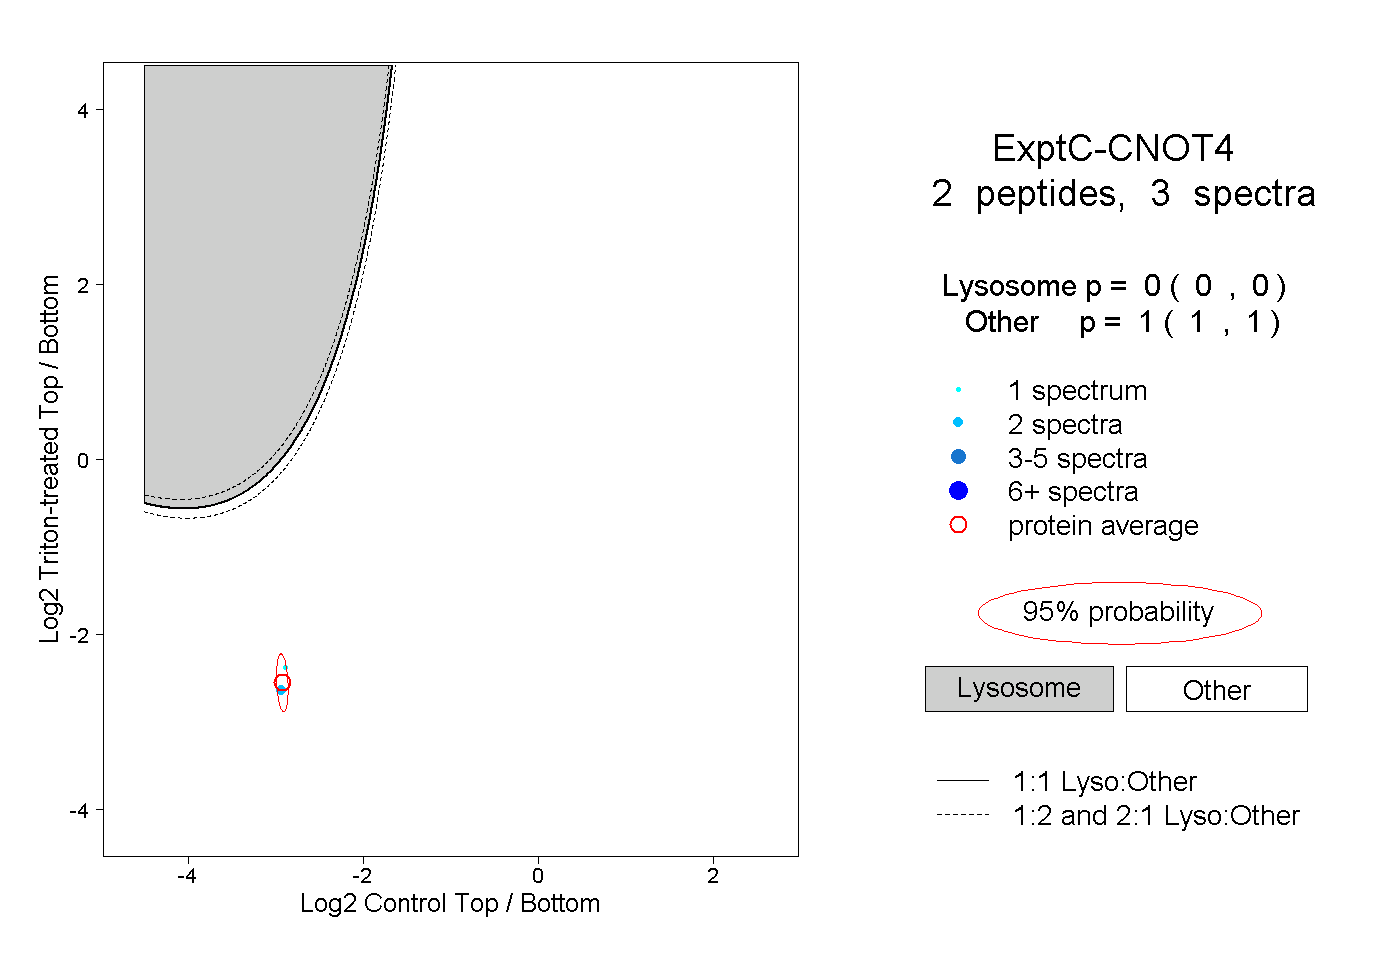 |
0.000 0.000 | 0.000 |
1.000 1.000 | 1.000 |
||||||||
| Plot | Lyso | Other | |||||||||||
| Expt D |
1 peptide |
1 spectrum |
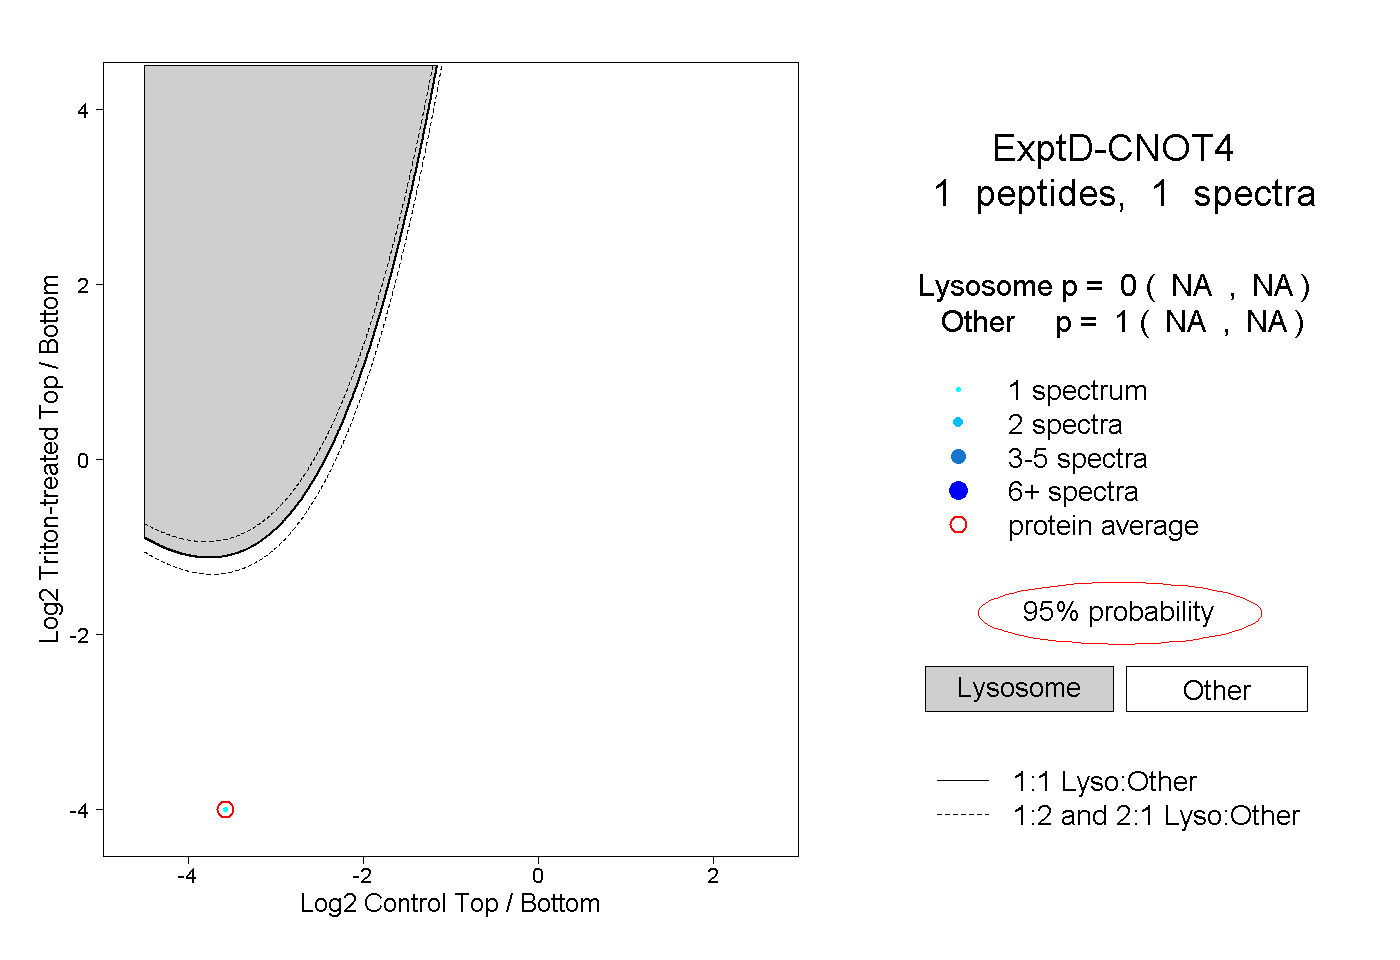 |
0.000 NA | NA |
1.000 NA | NA |