 6
6peptides
spectra
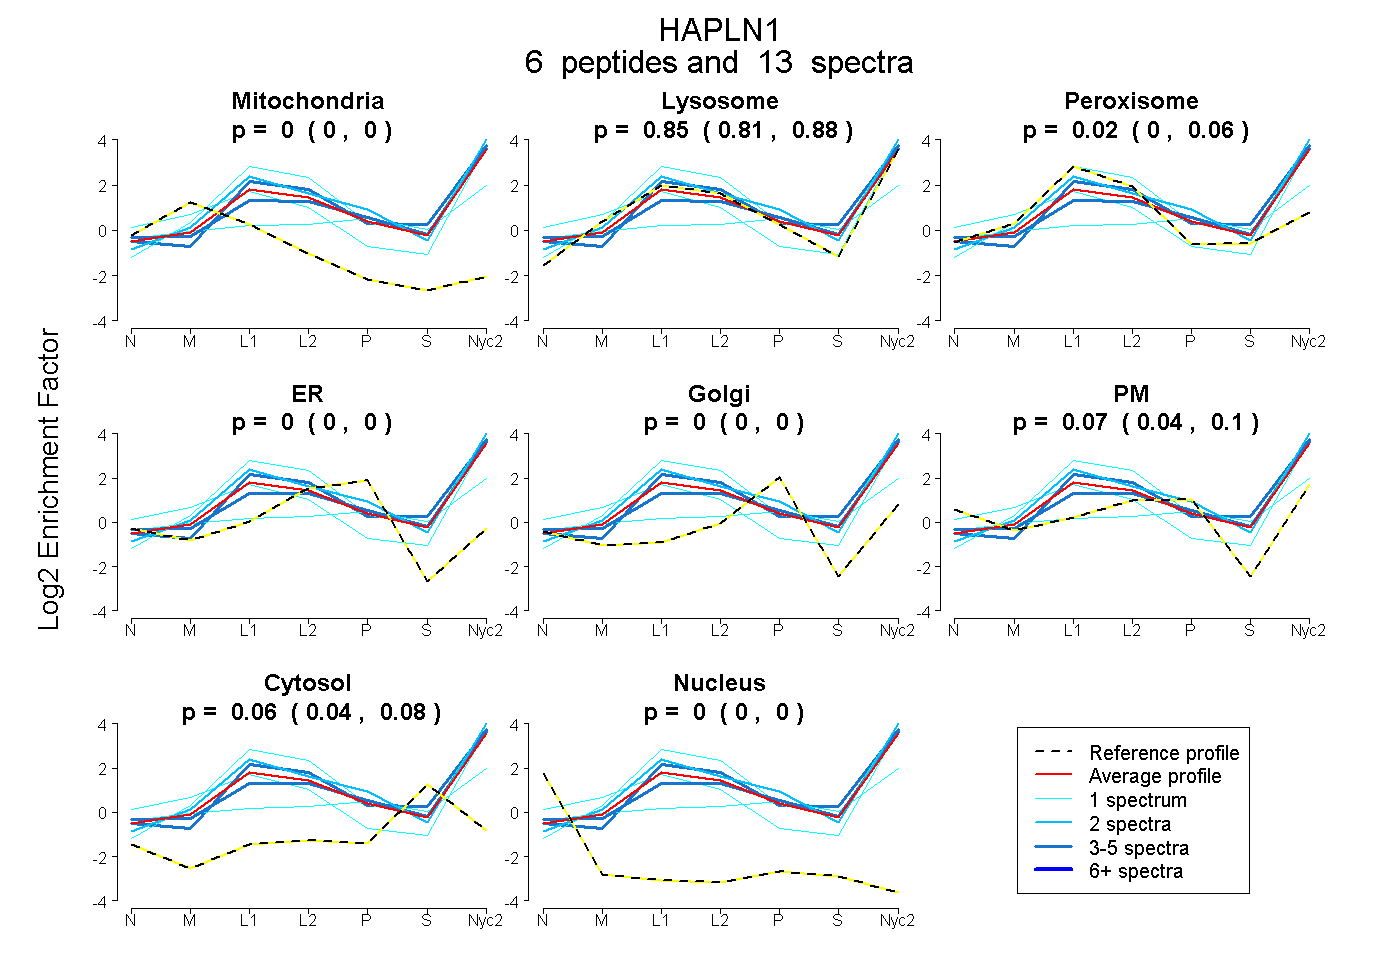
0.000 | 0.000
0.806 | 0.881
0.000 | 0.062
0.000 | 0.000
0.000 | 0.000
0.036 | 0.096
0.043 | 0.078
0.000 | 0.000
8peptides
spectra
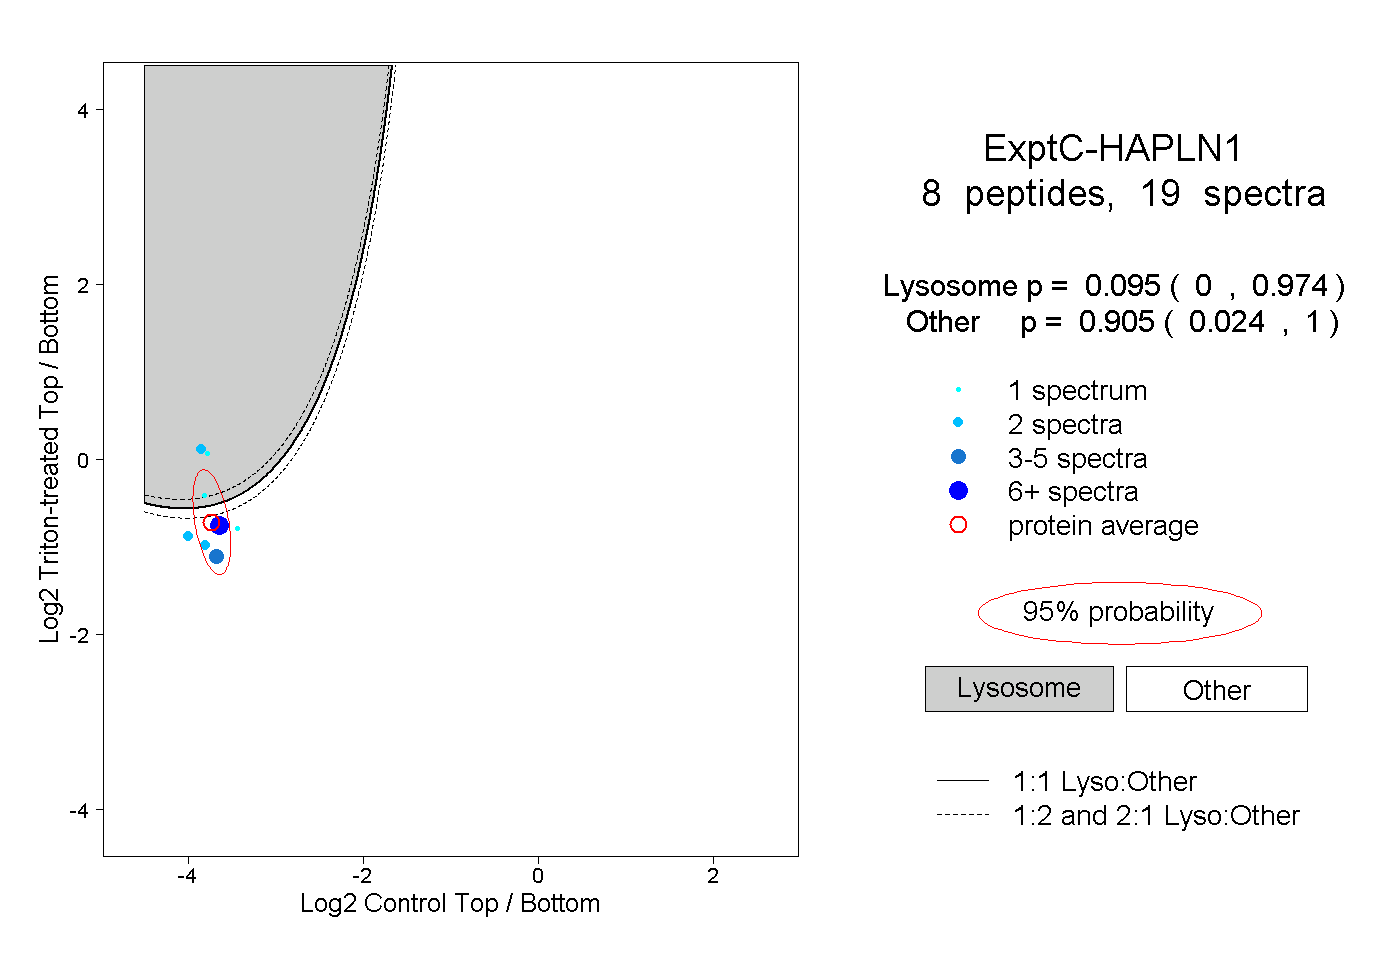
0.000 | 0.974
0.024 | 1.000
1peptide
spectra
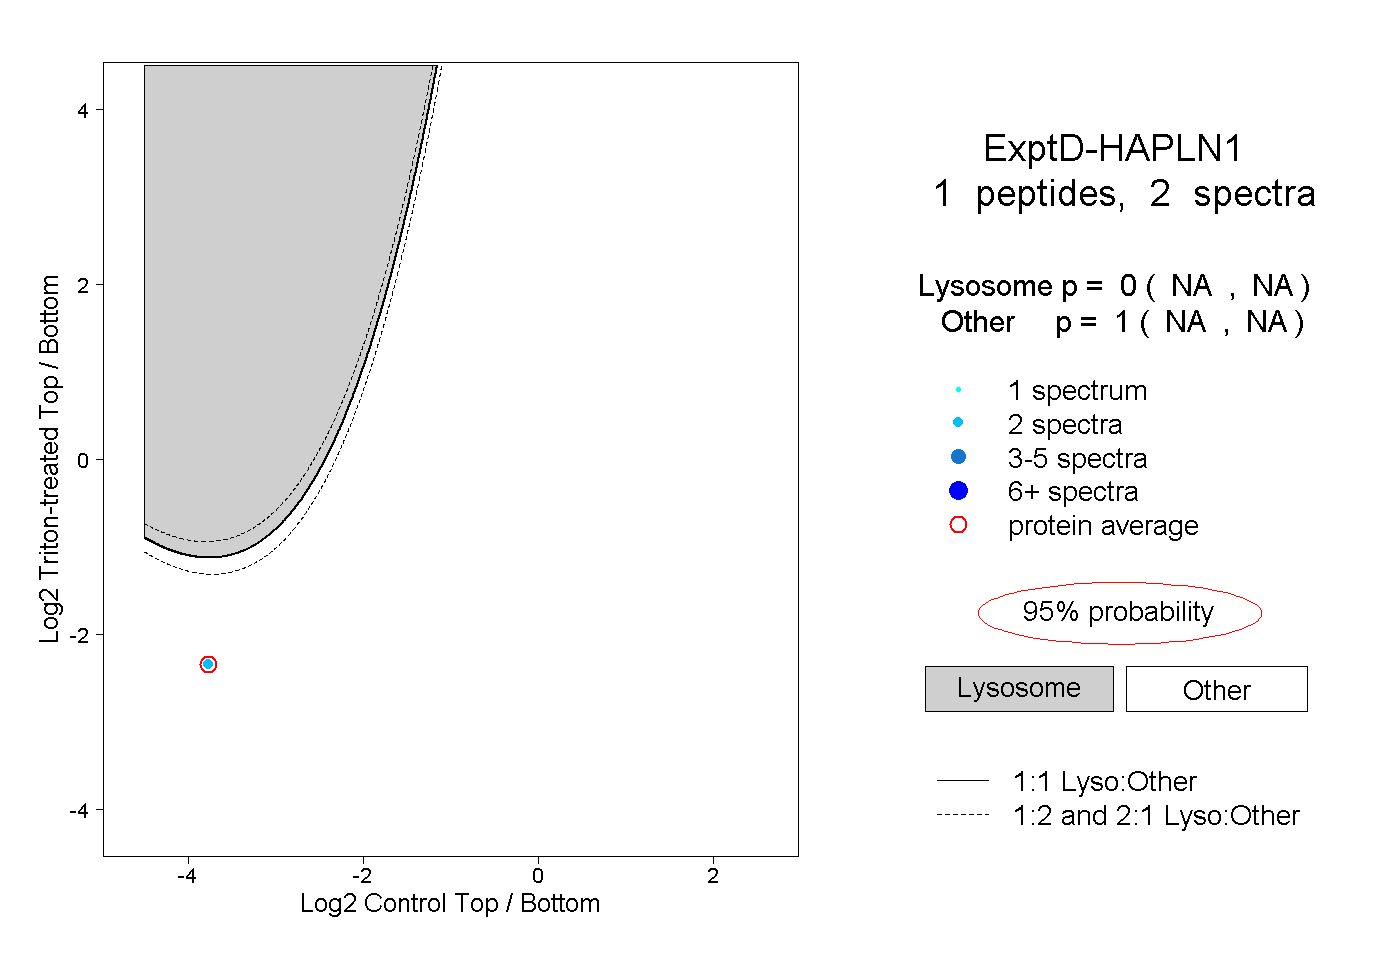
NA | NA
NA | NA