 6
6peptides
spectra
0.000 | 0.000
0.806 | 0.881
0.000 | 0.062
0.000 | 0.000
0.000 | 0.000
0.036 | 0.096
0.043 | 0.078
0.000 | 0.000
8peptides
spectra
0.000 | 0.974
0.024 | 1.000
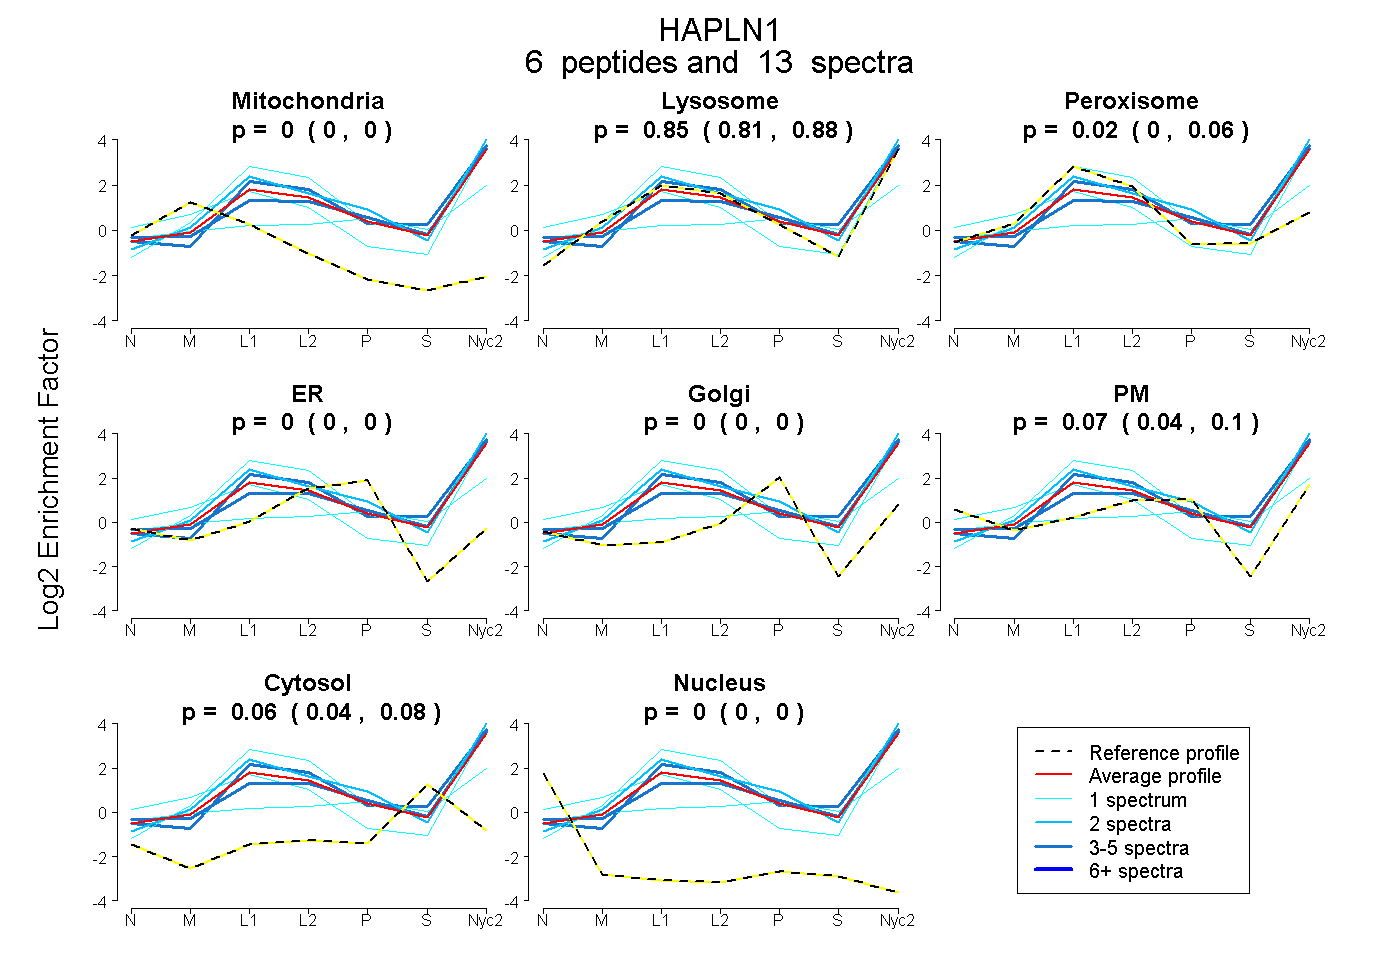
| Plot | Mito | Lyso | Perox | ER | Golgi | PM | Cytosol | Nucleus | |||||
| Expt A |
6 peptides |
13 spectra |
|
0.000 0.000 | 0.000 |
0.848 0.806 | 0.881 |
0.021 0.000 | 0.062 |
0.000 0.000 | 0.000 |
0.000 0.000 | 0.000 |
0.070 0.036 | 0.096 |
0.062 0.043 | 0.078 |
0.000 0.000 | 0.000 |
||
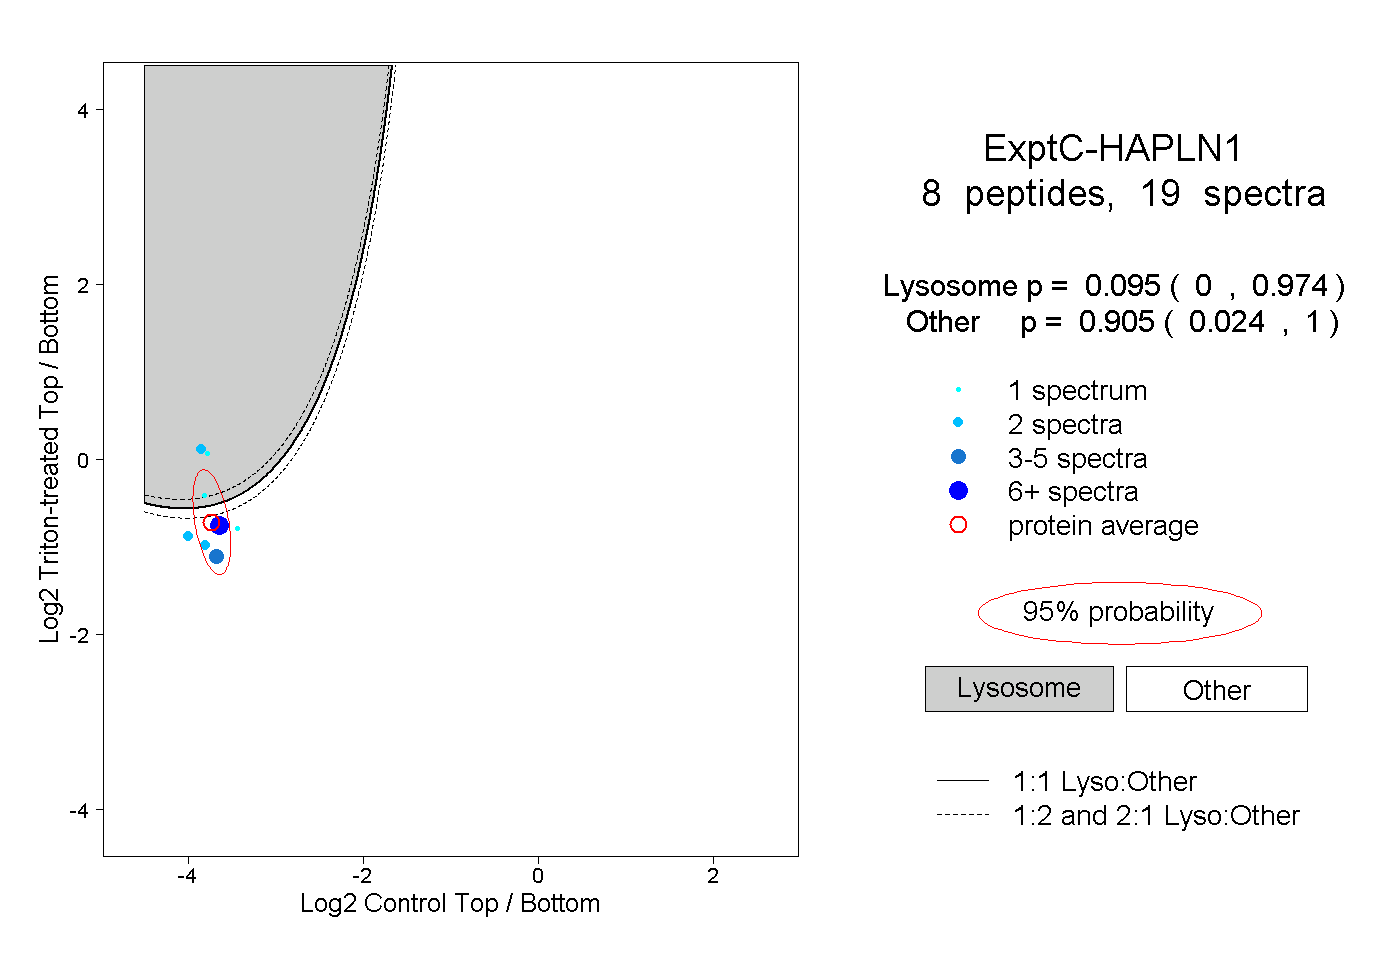
| Plot | Lyso | Other | |||||||||||
| Expt C |
8 peptides |
19 spectra |
|
0.095 0.000 | 0.974 |
0.905 0.024 | 1.000 |
| 2 spectra, LTSDYLR | 0.005 | 0.995 | ||||||||
| 1 spectrum, VGQLFAAWK | 0.837 | 0.163 | ||||||||
| 1 spectrum, TYGGYQGR | 0.016 | 0.984 | ||||||||
| 6 spectra, LYGVYCFR | 0.047 | 0.953 | ||||||||
| 4 spectra, YNLNFHEAR | 0.001 | 0.999 | ||||||||
| 1 spectrum, CSPTEAAVR | 0.999 | 0.001 | ||||||||
| 2 spectra, EPCGGQNTVPGVR | 1.000 | 0.000 | ||||||||
| 2 spectra, YPISRPR | 0.016 | 0.984 |
| Plot | Lyso | Other | |||||||||||
| Expt D |
1 peptide |
2 spectra |
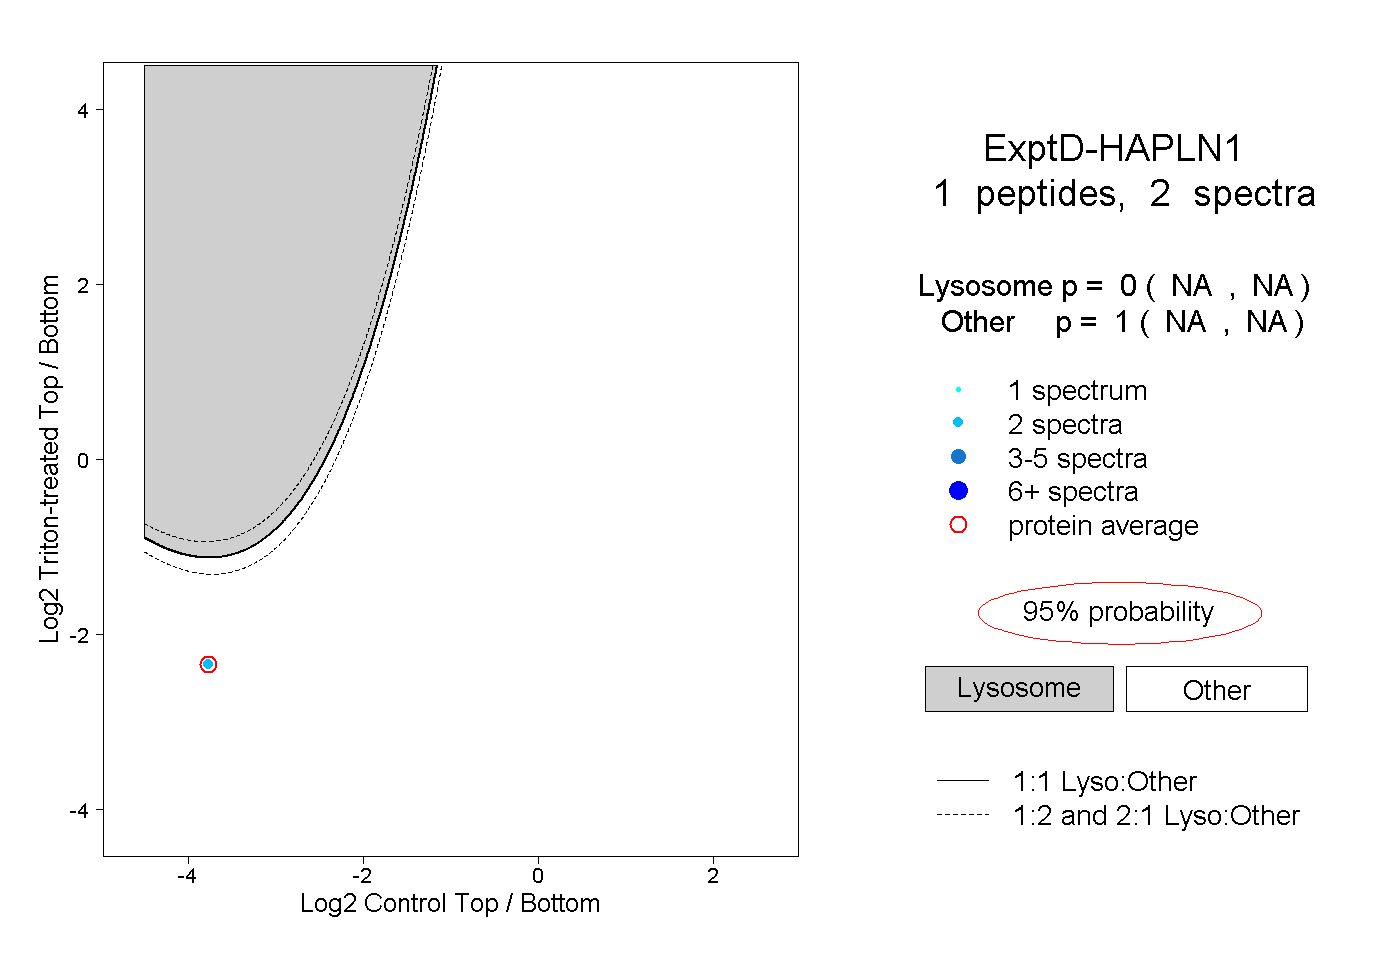 |
0.000 NA | NA |
1.000 NA | NA |