 12
12peptides
spectra
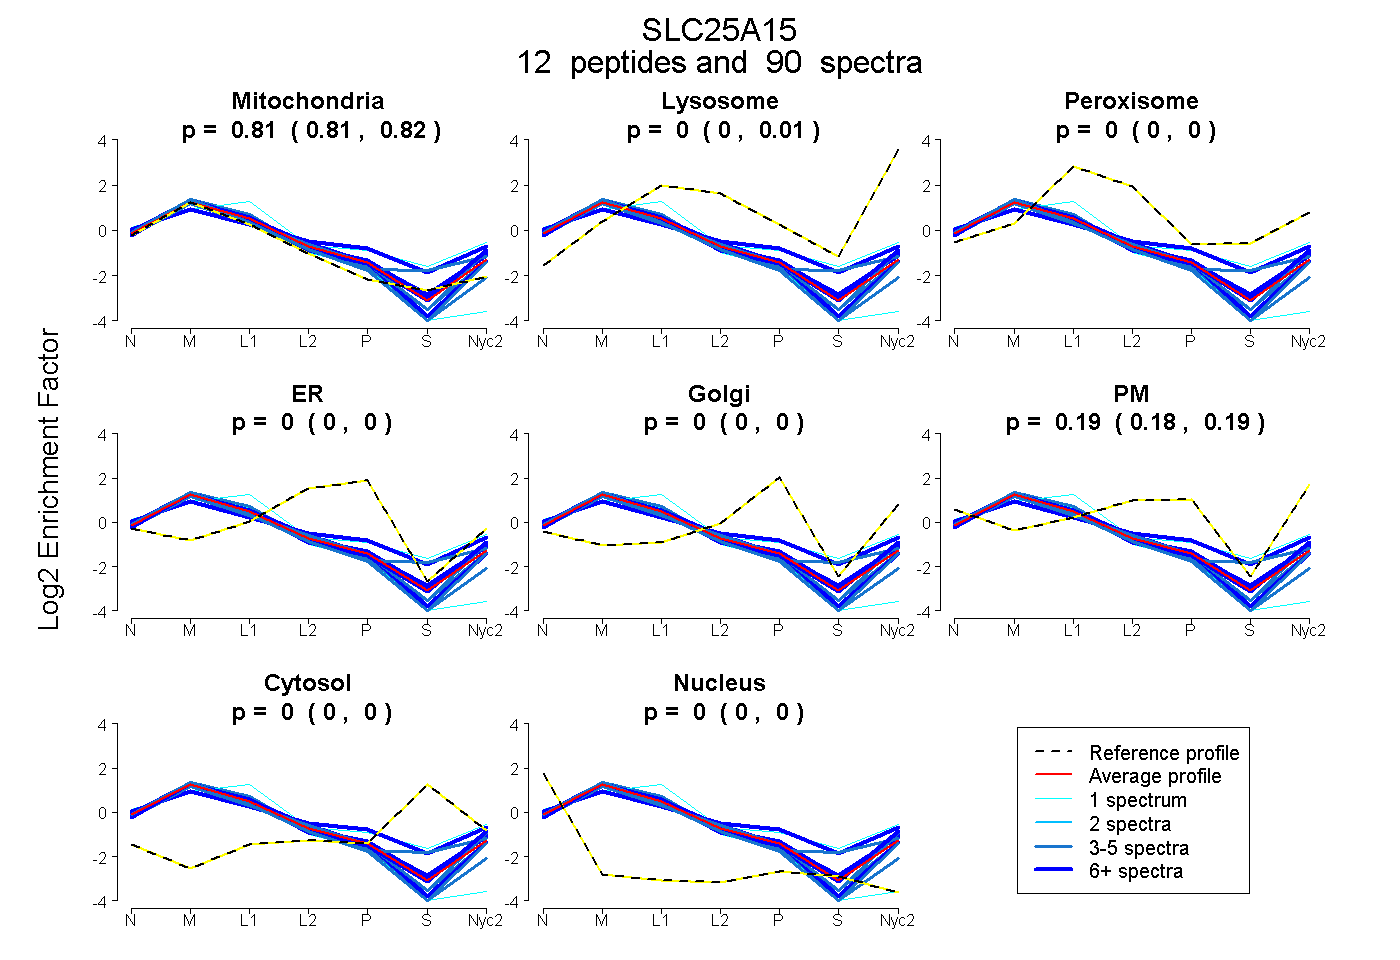
0.808 | 0.816
0.000 | 0.006
0.000 | 0.000
0.000 | 0.002
0.000 | 0.000
0.180 | 0.190
0.000 | 0.000
0.000 | 0.000
12peptides
spectra
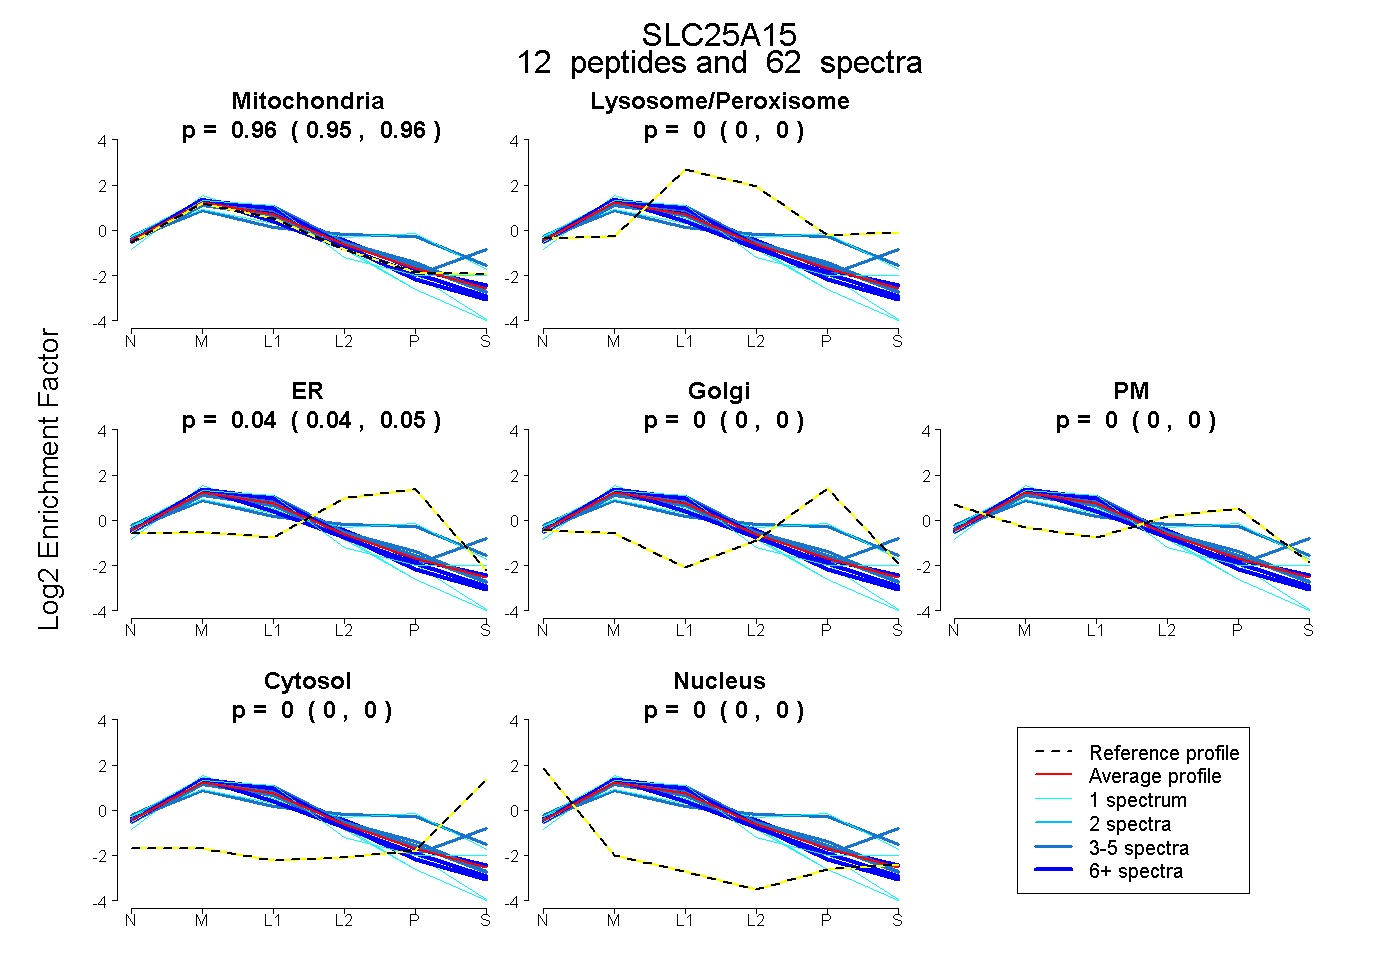
0.948 | 0.963
0.000 | 0.000
0.035 | 0.050
0.000 | 0.000
0.000 | 0.000
0.000 | 0.000
0.000 | 0.000
12peptides
spectra
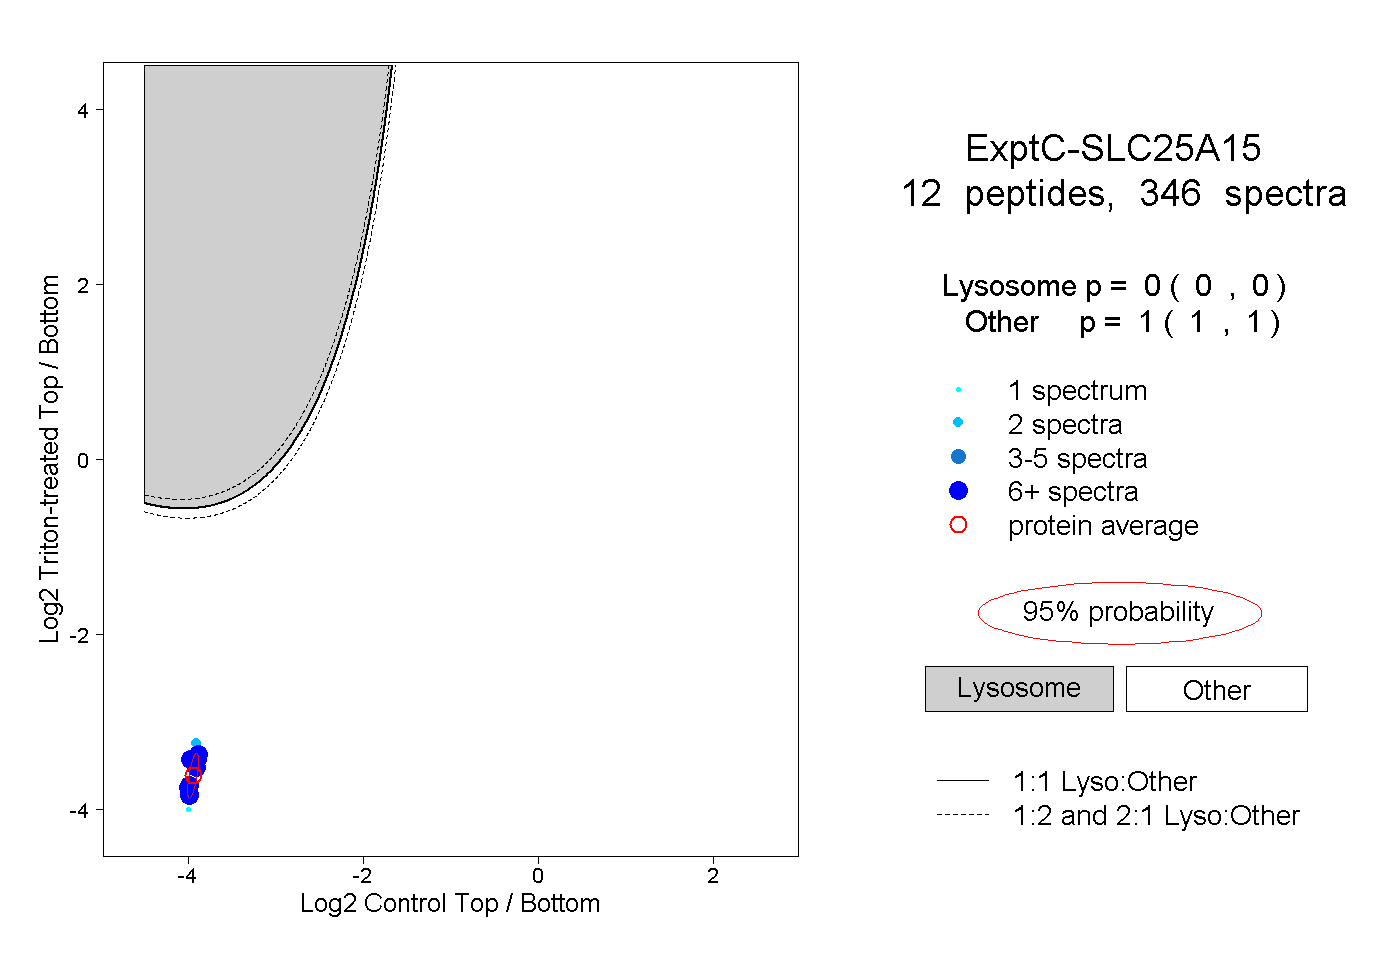
0.000 | 0.000
1.000 | 1.000
9peptides
spectra
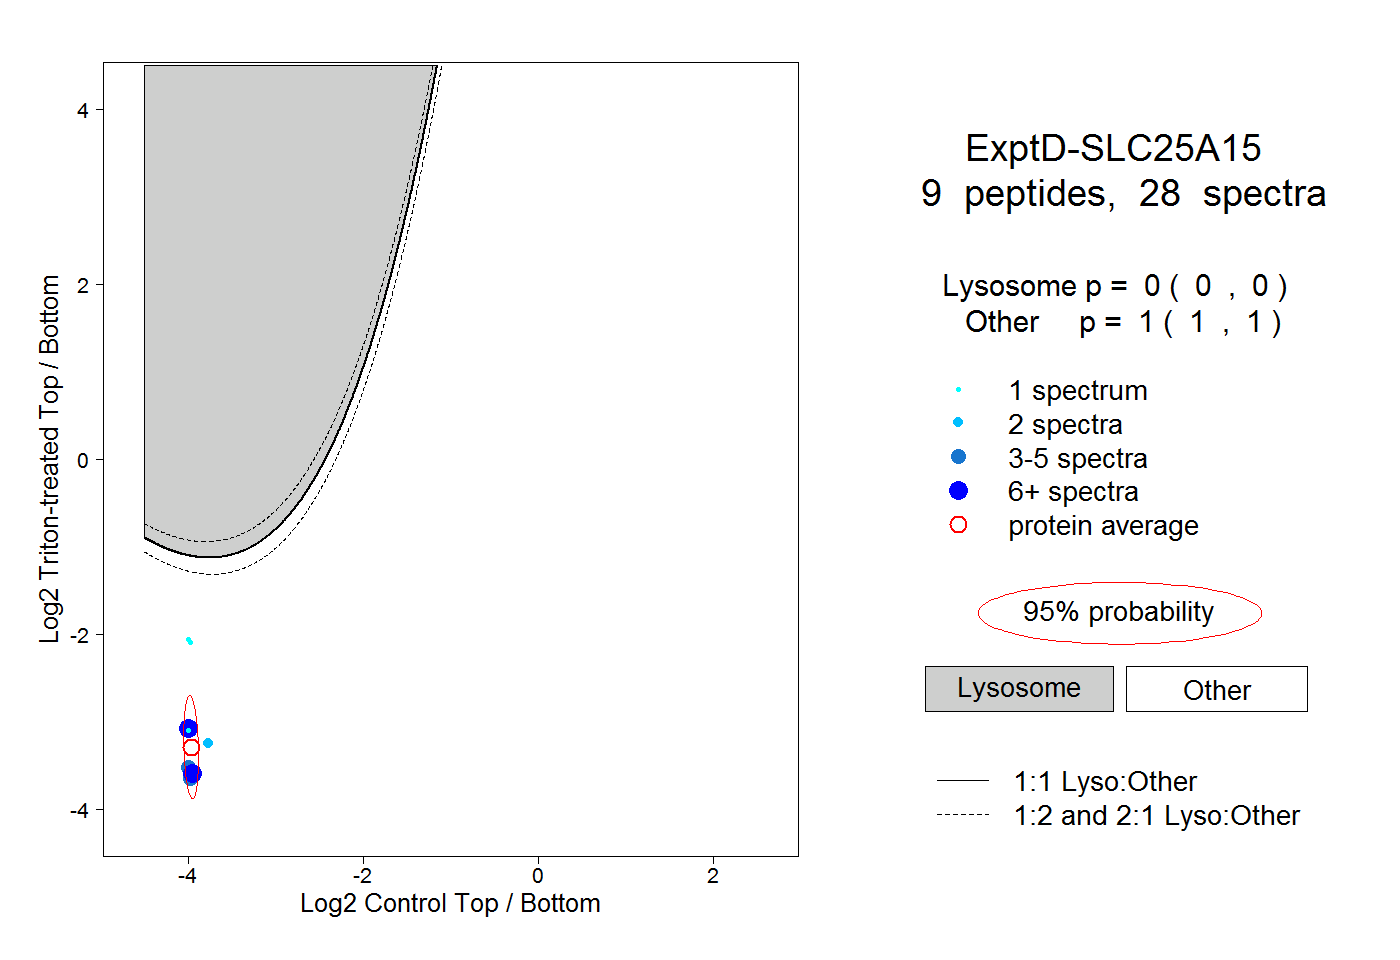
0.000 | 0.000
1.000 | 1.000