 12
12peptides
spectra
0.808 | 0.816
0.000 | 0.006
0.000 | 0.000
0.000 | 0.002
0.000 | 0.000
0.180 | 0.190
0.000 | 0.000
0.000 | 0.000
| Plot | Mito | Lyso | Perox | ER | Golgi | PM | Cytosol | Nucleus | |||||
| Expt A |
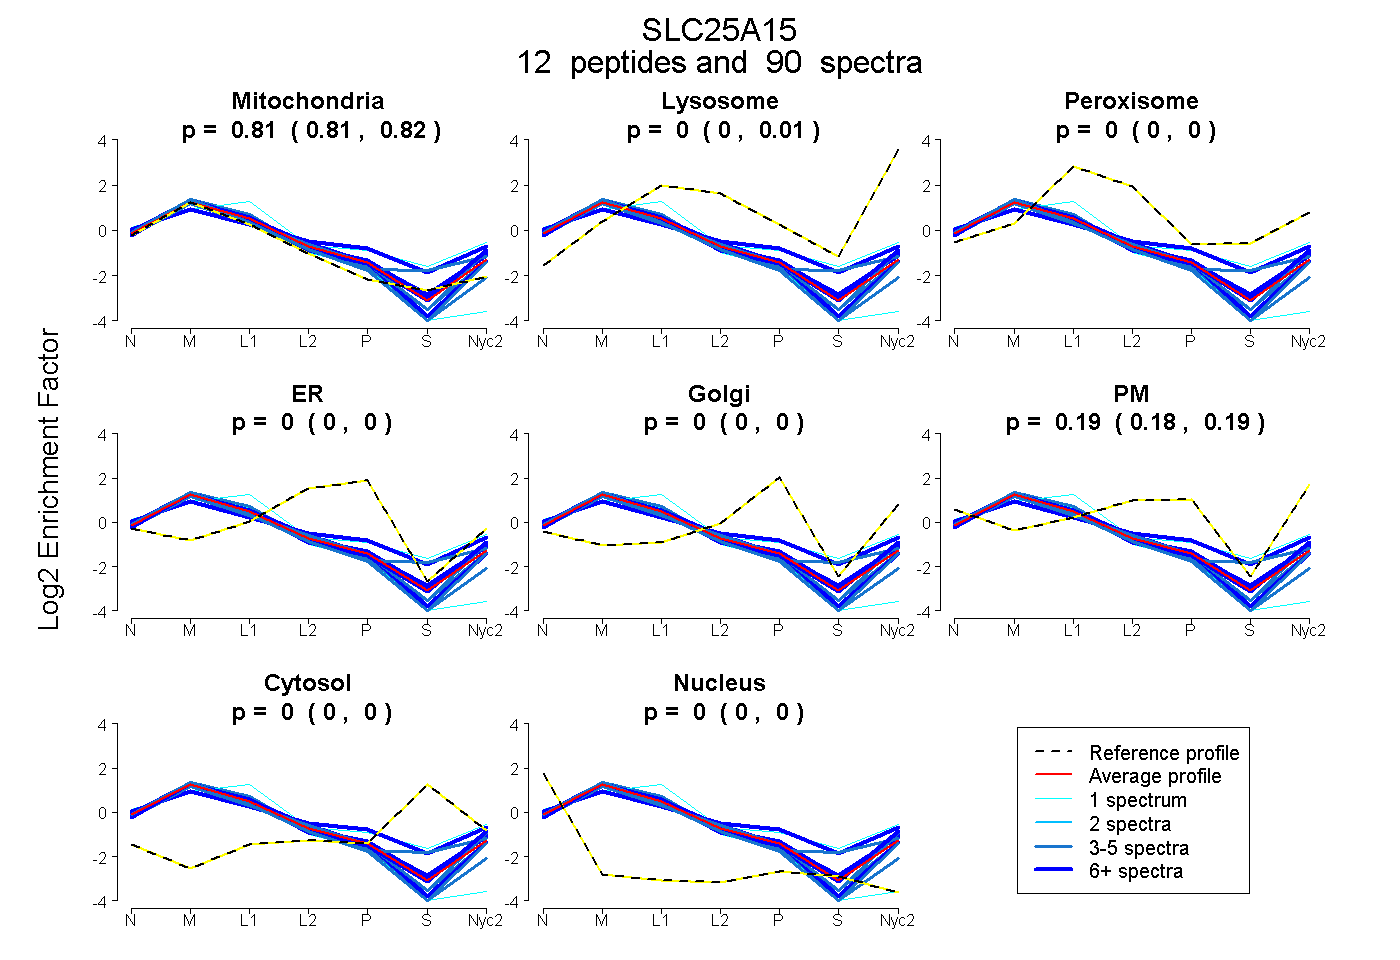
12 peptides |
90 spectra |
|
0.812 0.808 | 0.816 |
0.001 0.000 | 0.006 |
0.000 0.000 | 0.000 |
0.000 0.000 | 0.002 |
0.000 0.000 | 0.000 |
0.187 0.180 | 0.190 |
0.000 0.000 | 0.000 |
0.000 0.000 | 0.000 |
| 8 spectra, LQTMYEMETSGK | 0.590 | 0.012 | 0.076 | 0.000 | 0.073 | 0.207 | 0.042 | 0.000 | ||
| 3 spectra, IAASQNTVWSVVK | 0.848 | 0.000 | 0.000 | 0.000 | 0.000 | 0.152 | 0.000 | 0.000 | ||
| 1 spectrum, DGPLGFYHGLSSTLLR | 0.554 | 0.005 | 0.277 | 0.000 | 0.027 | 0.122 | 0.015 | 0.000 | ||
| 3 spectra, VVGLDR | 0.885 | 0.000 | 0.000 | 0.000 | 0.000 | 0.115 | 0.000 | 0.000 | ||
| 3 spectra, QTGLIR | 0.762 | 0.082 | 0.070 | 0.000 | 0.000 | 0.015 | 0.071 | 0.000 | ||
| 22 spectra, MQTFPDLYR | 0.783 | 0.053 | 0.000 | 0.000 | 0.000 | 0.164 | 0.000 | 0.000 | ||
| 12 spectra, TYSQVGFR | 0.799 | 0.066 | 0.000 | 0.000 | 0.000 | 0.135 | 0.000 | 0.000 | ||
| 1 spectrum, GLTDCCLR | 0.965 | 0.000 | 0.000 | 0.000 | 0.000 | 0.000 | 0.000 | 0.035 | ||
| 3 spectra, AFPANGALFLAYEYSR | 0.915 | 0.000 | 0.000 | 0.085 | 0.000 | 0.000 | 0.000 | 0.000 | ||
| 8 spectra, IQVLSMTGK | 0.788 | 0.054 | 0.000 | 0.000 | 0.000 | 0.159 | 0.000 | 0.000 | ||
| 4 spectra, TFLSIVK | 0.779 | 0.005 | 0.000 | 0.000 | 0.000 | 0.216 | 0.000 | 0.000 | ||
| 22 spectra, SFFASGR | 0.830 | 0.000 | 0.000 | 0.022 | 0.000 | 0.148 | 0.000 | 0.000 |
| Plot | Mito | Lyso or Perox | ER | Golgi | PM | Cytosol | Nucleus | ||||||
| Expt B |
12 peptides |
62 spectra |
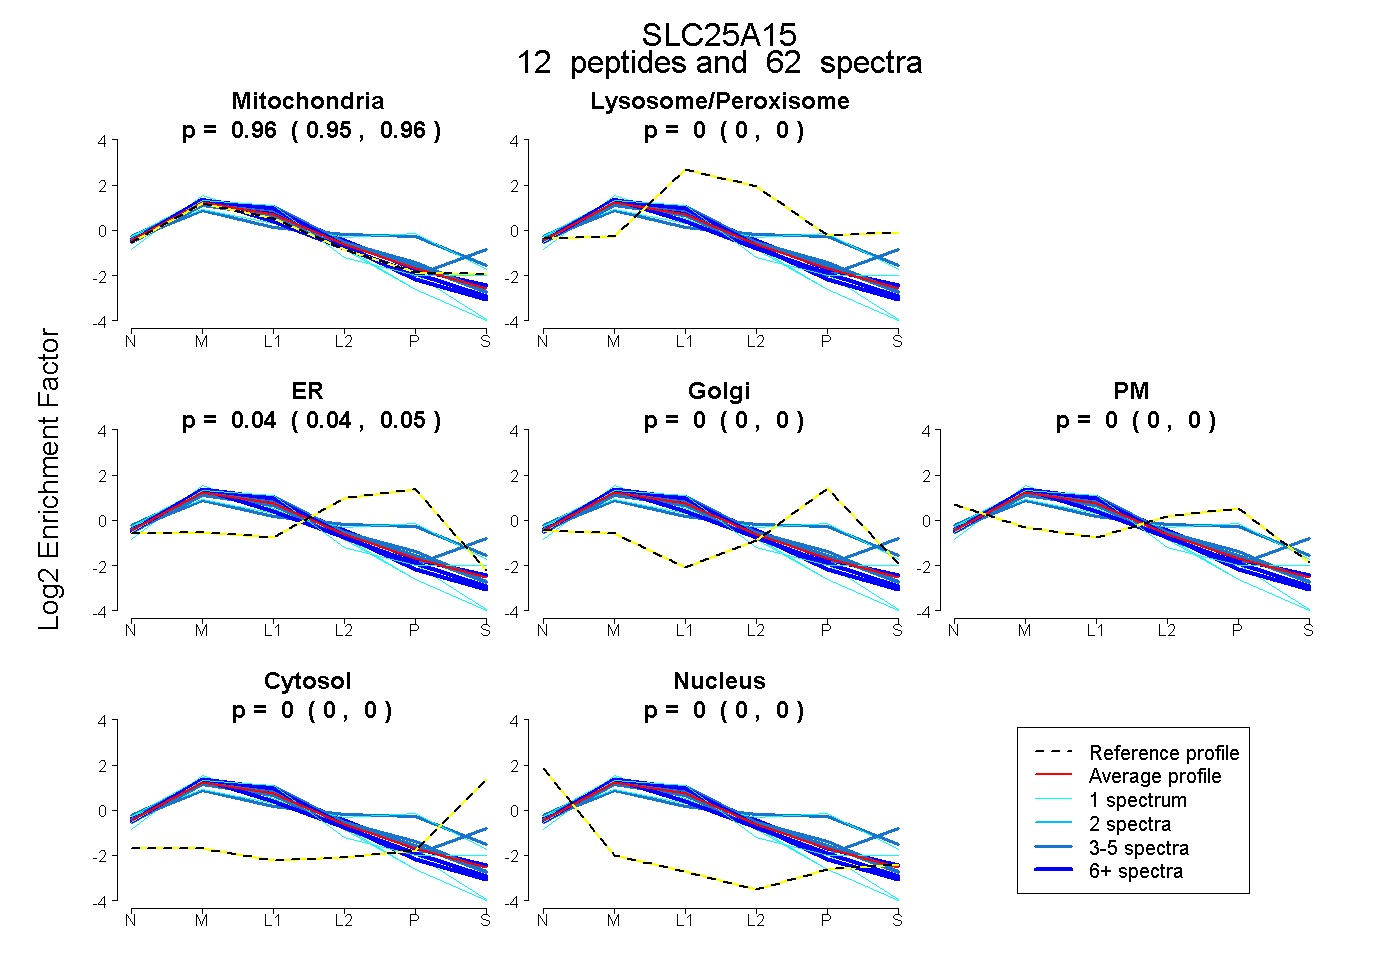 |
0.957 0.948 | 0.963 |
0.000 0.000 | 0.000 |
0.043 0.035 | 0.050 |
0.000 0.000 | 0.000 |
0.000 0.000 | 0.000 |
0.000 0.000 | 0.000 |
0.000 0.000 | 0.000 |
|||
| Plot | Lyso | Other | |||||||||||
| Expt C |
12 peptides |
346 spectra |
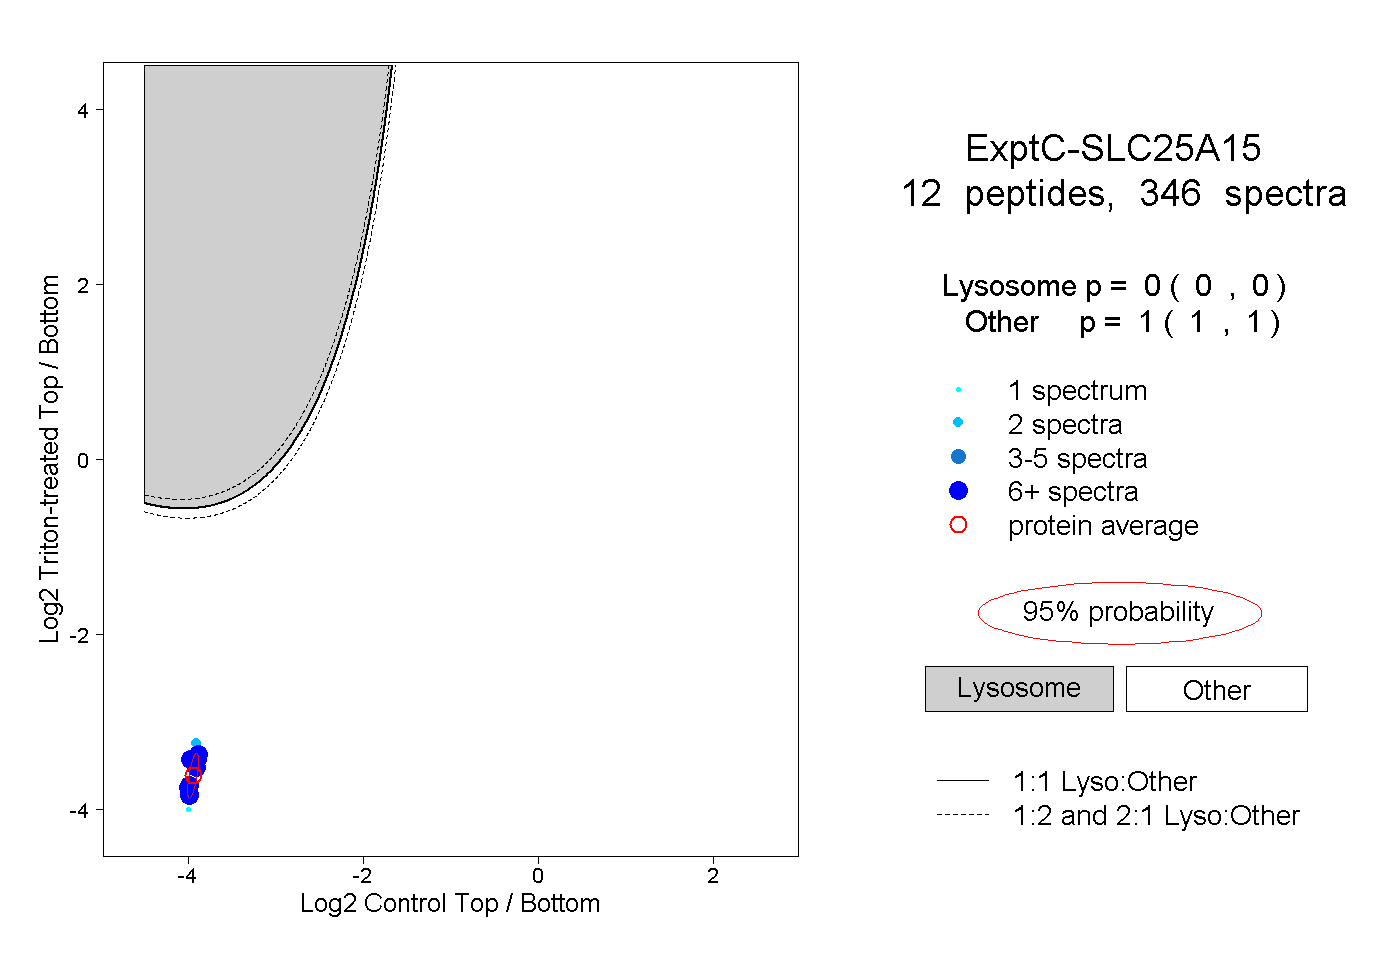 |
0.000 0.000 | 0.000 |
1.000 1.000 | 1.000 |
||||||||
| Plot | Lyso | Other | |||||||||||
| Expt D |
9 peptides |
28 spectra |
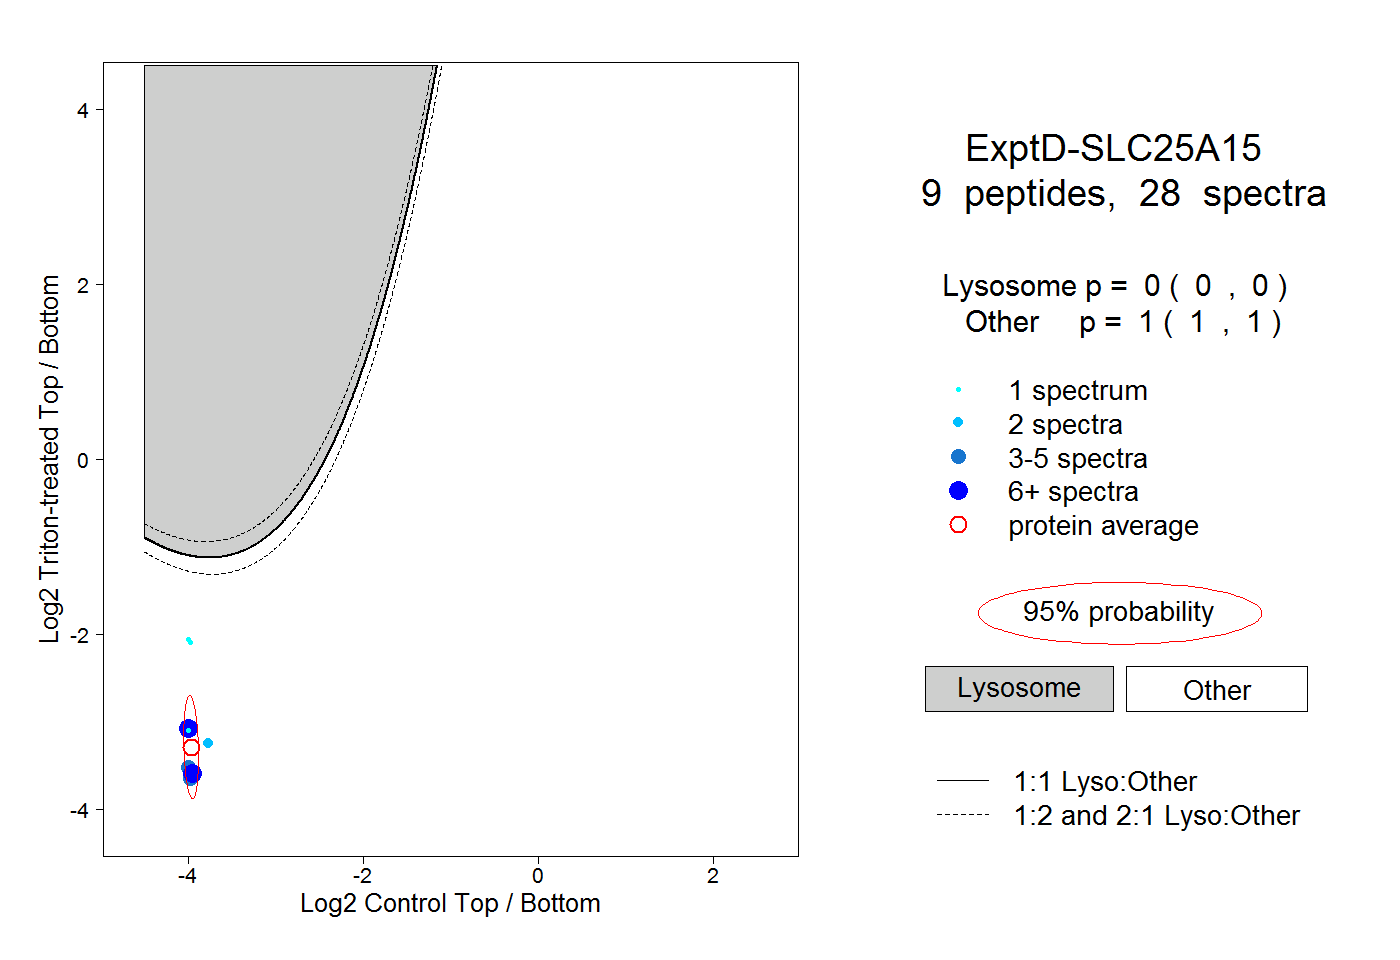 |
0.000 0.000 | 0.000 |
1.000 1.000 | 1.000 |