 3
3peptides
spectra
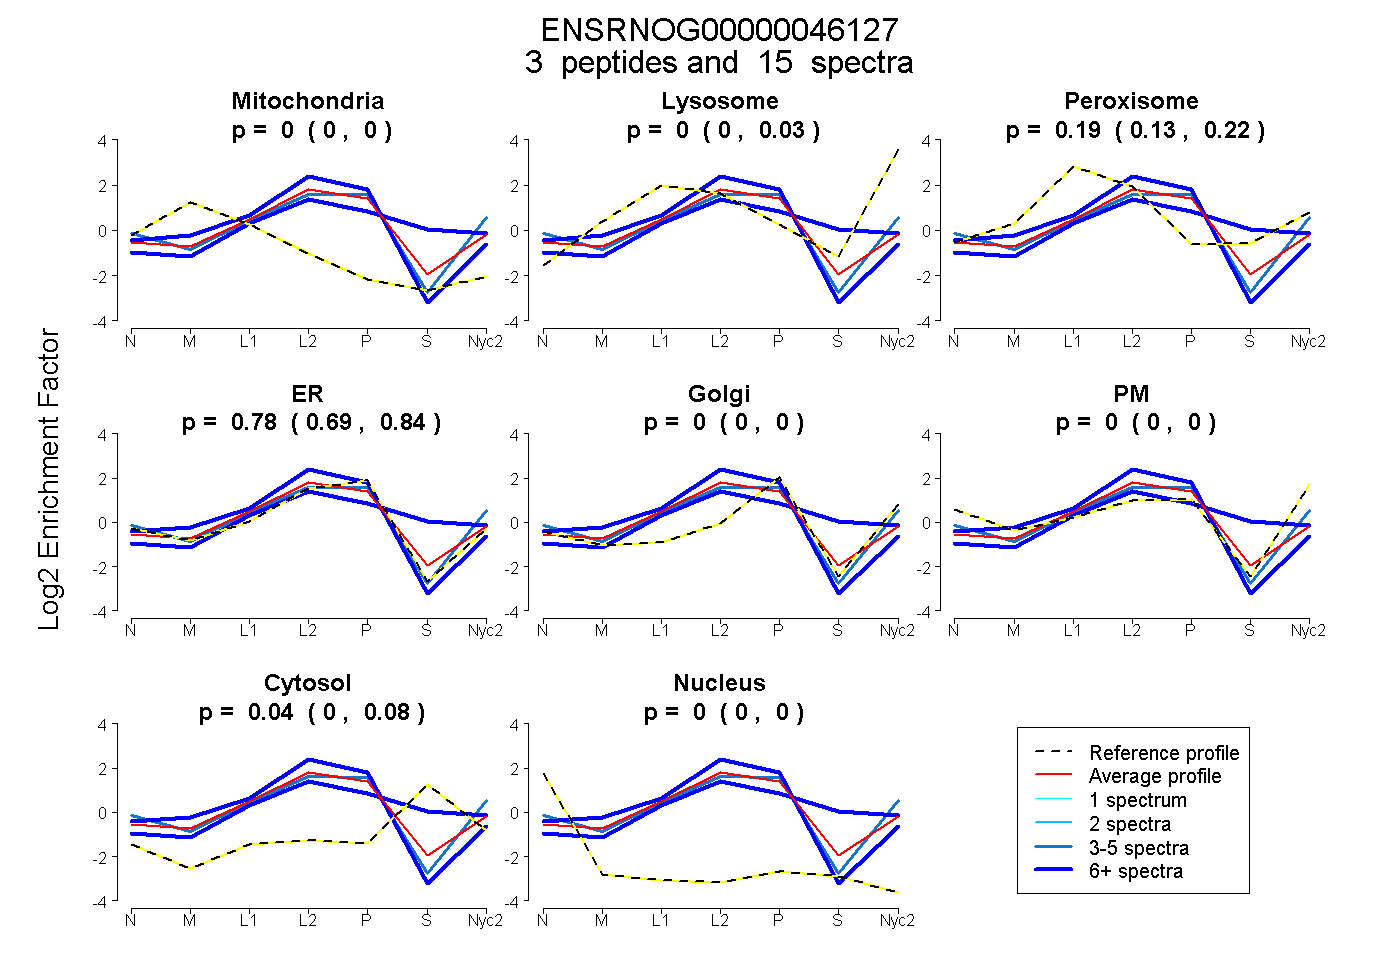
0.000 | 0.000
0.000 | 0.028
0.131 | 0.221
0.695 | 0.841
0.000 | 0.000
0.000 | 0.000
0.000 | 0.077
0.000 | 0.000
3peptides
spectra
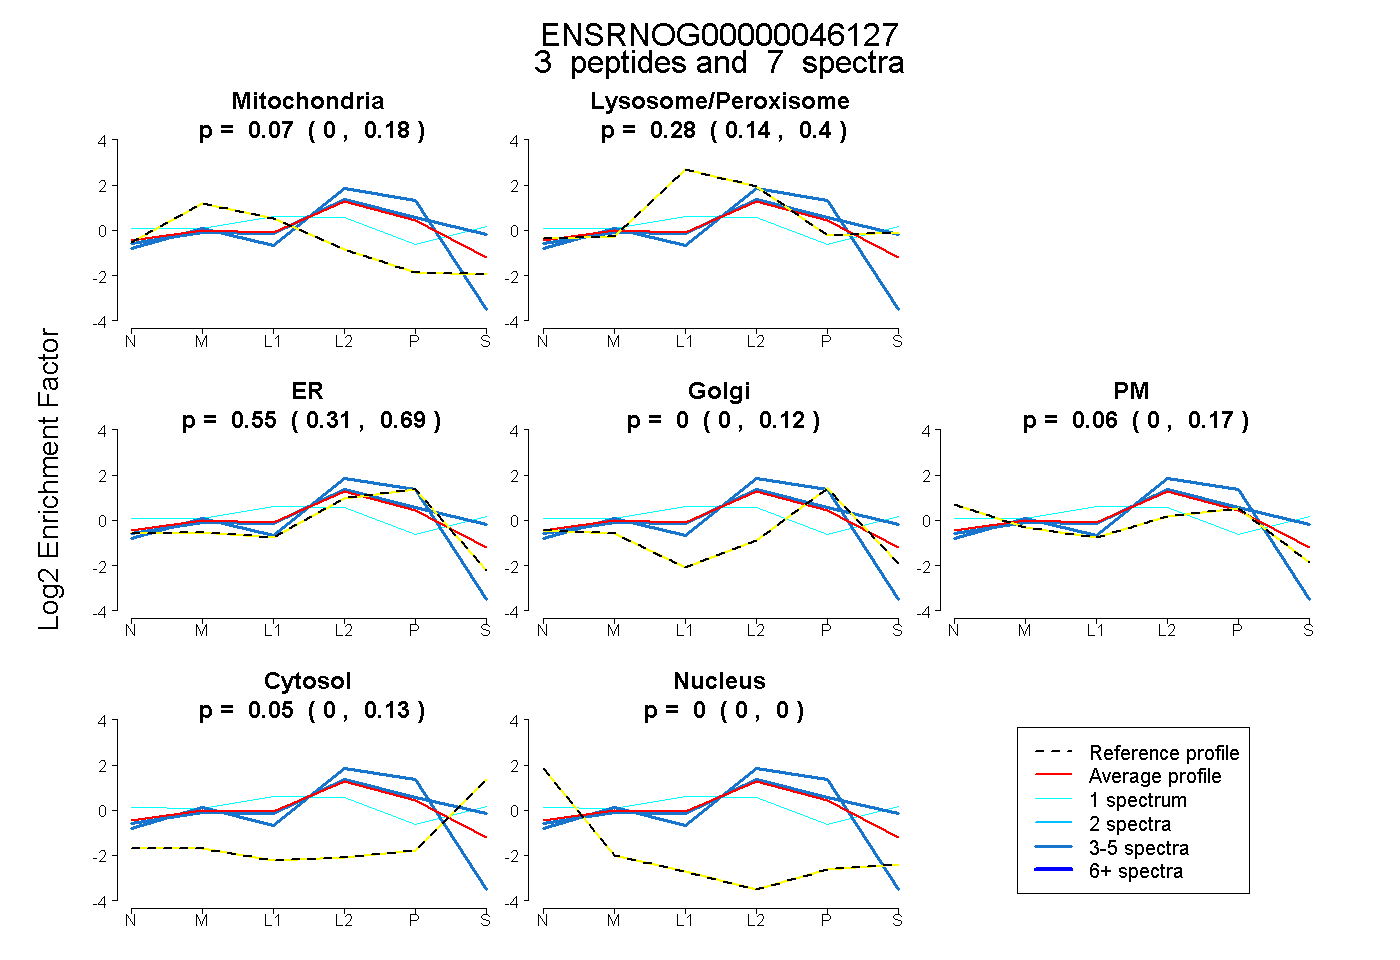
0.000 | 0.177
0.144 | 0.400
0.313 | 0.688
0.000 | 0.125
0.000 | 0.166
0.000 | 0.131
0.000 | 0.000
4peptides
spectra
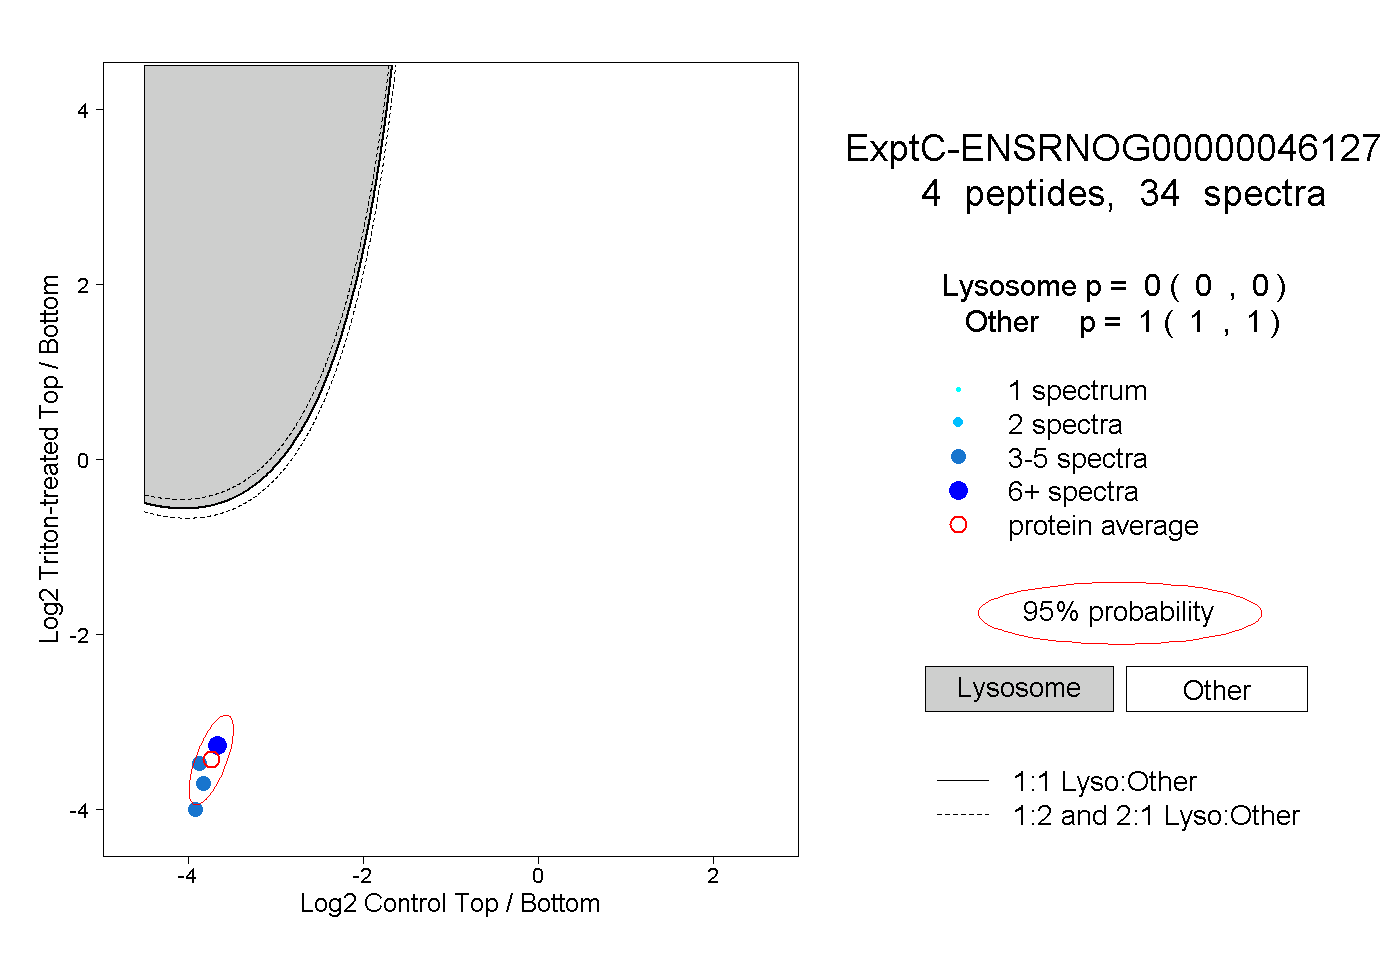
0.000 | 0.000
1.000 | 1.000
1peptide
spectra
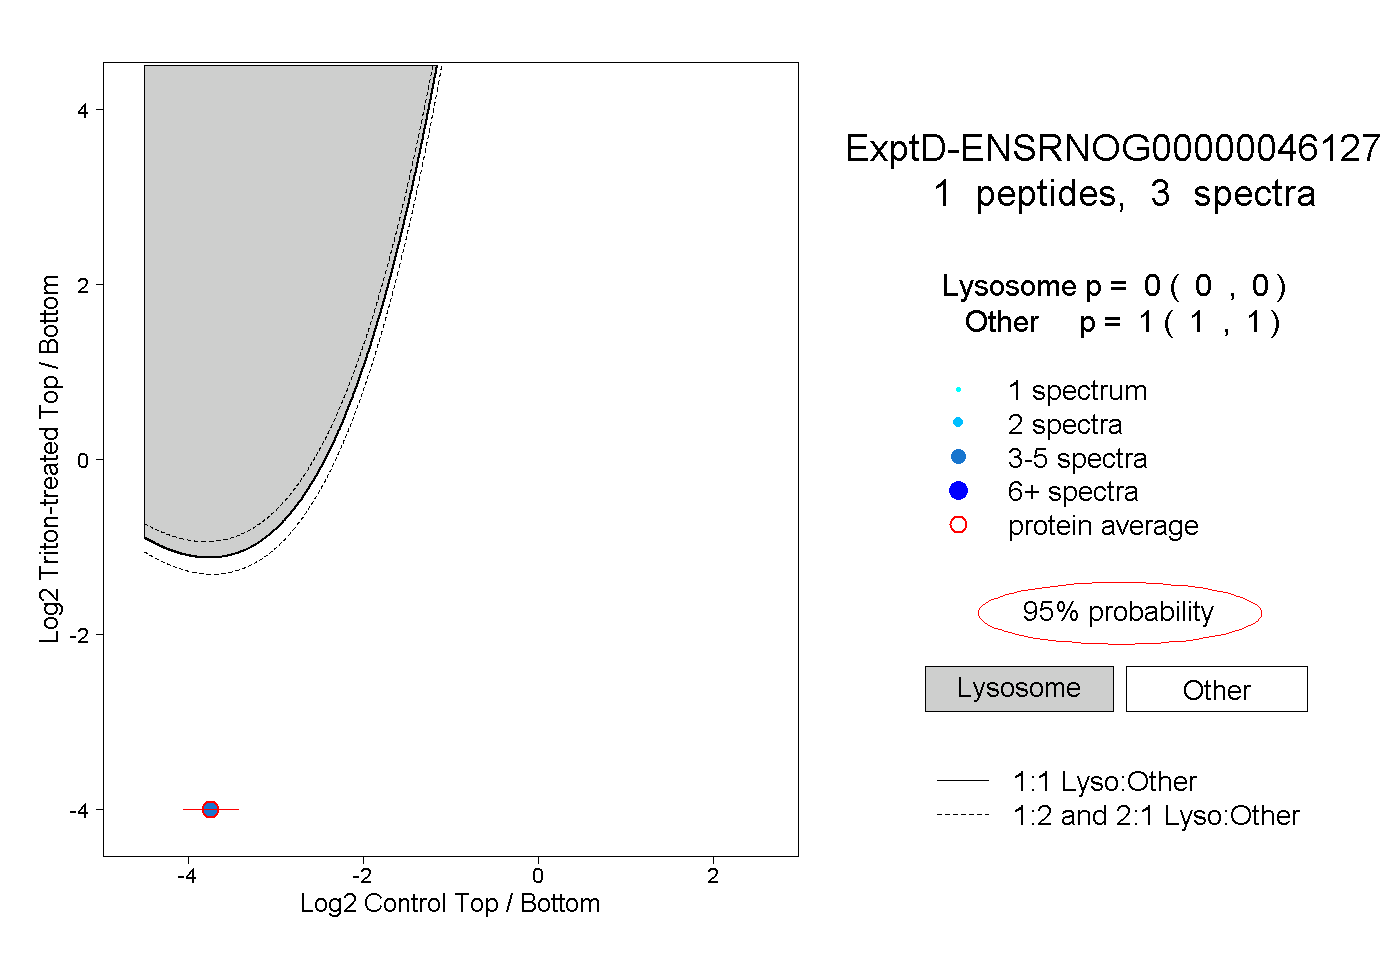
0.000 | 0.000
1.000 | 1.000