 3
3peptides
spectra
0.000 | 0.000
0.000 | 0.028
0.131 | 0.221
0.695 | 0.841
0.000 | 0.000
0.000 | 0.000
0.000 | 0.077
0.000 | 0.000
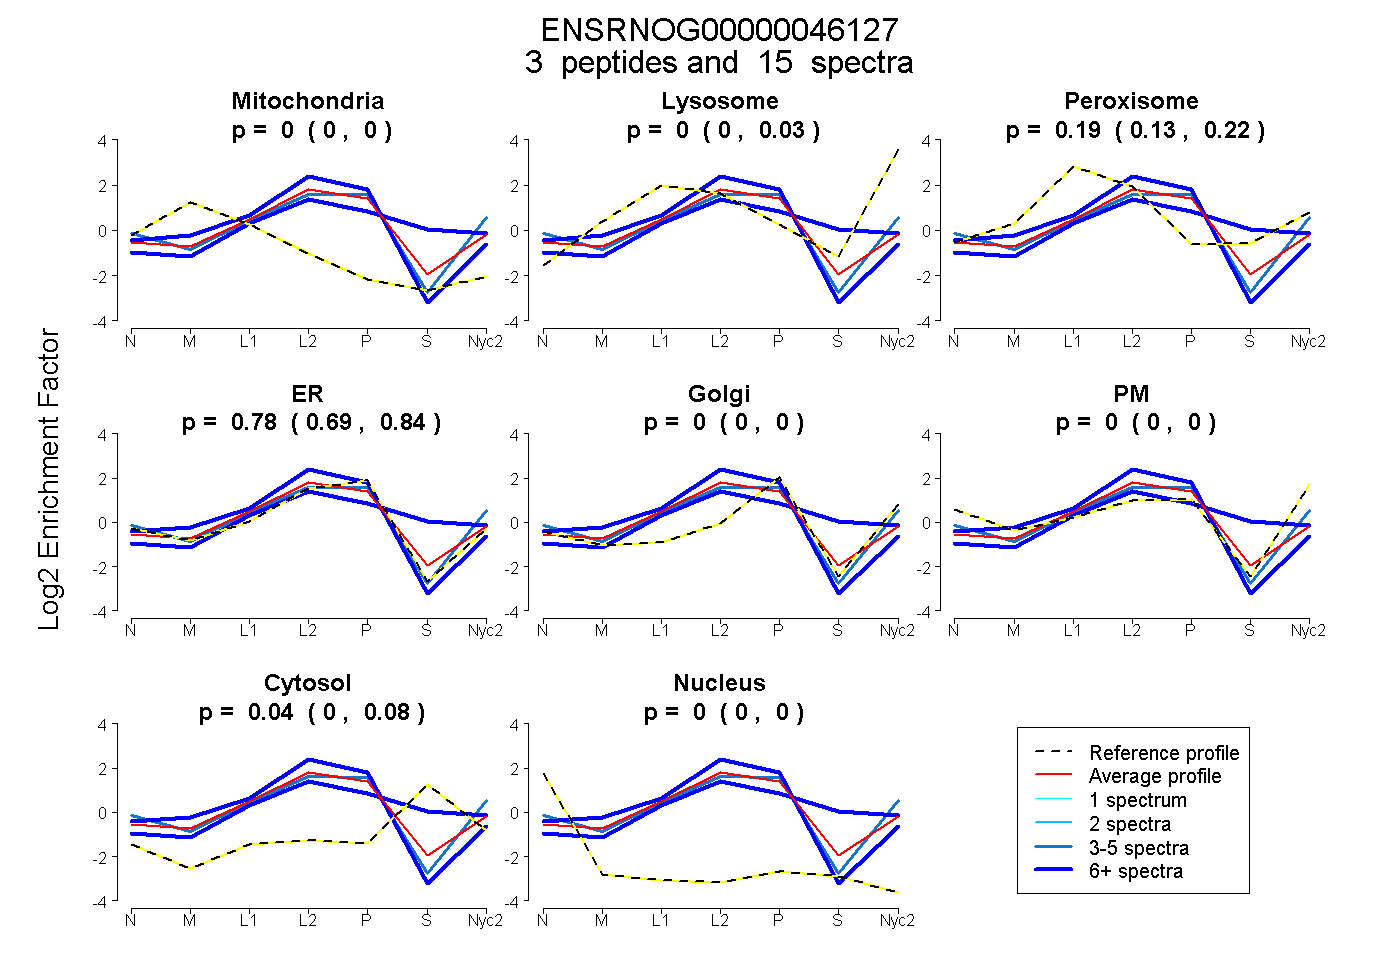
| Plot | Mito | Lyso | Perox | ER | Golgi | PM | Cytosol | Nucleus | |||||
| Expt A |
3 peptides |
15 spectra |
|
0.000 0.000 | 0.000 |
0.000 0.000 | 0.028 |
0.187 0.131 | 0.221 |
0.776 0.695 | 0.841 |
0.000 0.000 | 0.000 |
0.000 0.000 | 0.000 |
0.037 0.000 | 0.077 |
0.000 0.000 | 0.000 |
| 6 spectra, LLSTVAQAVK | 0.000 | 0.021 | 0.272 | 0.392 | 0.000 | 0.000 | 0.315 | 0.000 | ||
| 6 spectra, VSSLIER | 0.000 | 0.000 | 0.063 | 0.937 | 0.000 | 0.000 | 0.000 | 0.000 | ||
| 3 spectra, GQGTICWVDCGDAESR | 0.000 | 0.081 | 0.000 | 0.701 | 0.000 | 0.219 | 0.000 | 0.000 |
| Plot | Mito | Lyso or Perox | ER | Golgi | PM | Cytosol | Nucleus | ||||||
| Expt B |
3 peptides |
7 spectra |
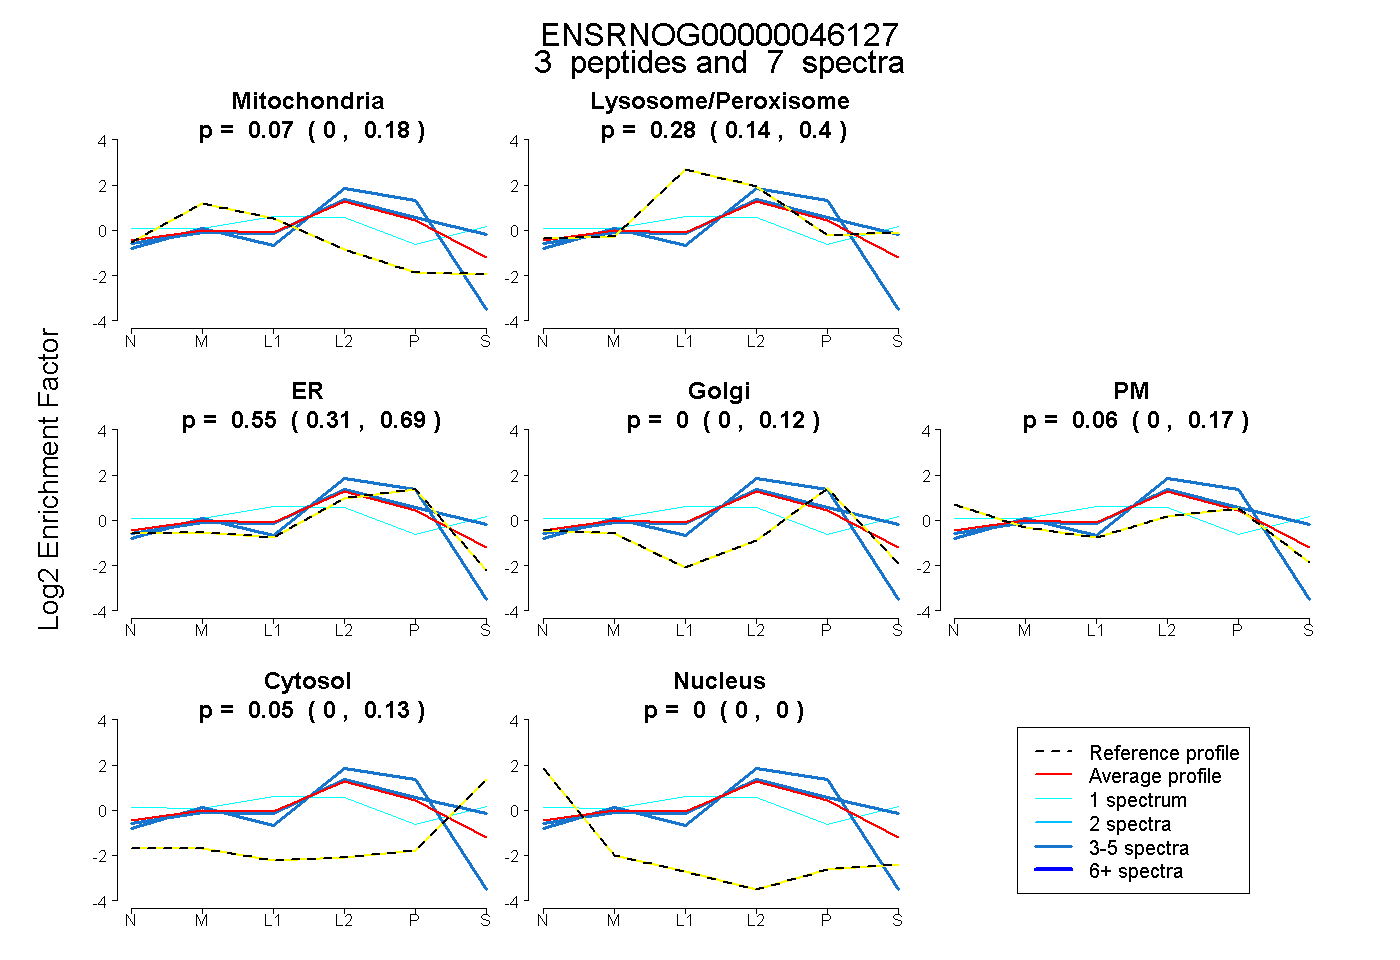 |
0.072 0.000 | 0.177 |
0.277 0.144 | 0.400 |
0.550 0.313 | 0.688 |
0.000 0.000 | 0.125 |
0.056 0.000 | 0.166 |
0.045 0.000 | 0.131 |
0.000 0.000 | 0.000 |
|||
| Plot | Lyso | Other | |||||||||||
| Expt C |
4 peptides |
34 spectra |
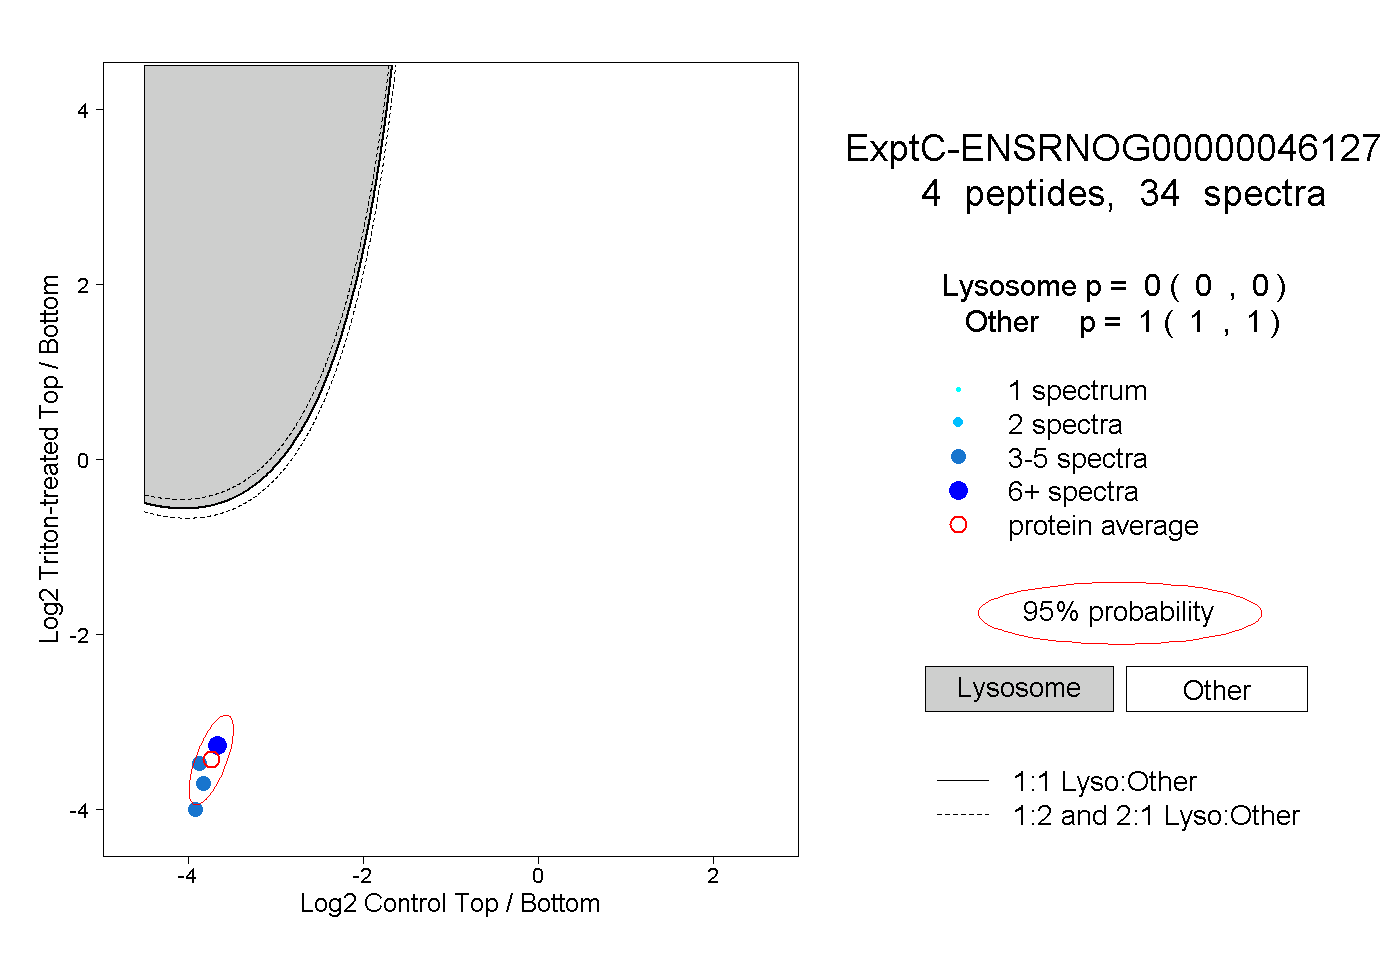 |
0.000 0.000 | 0.000 |
1.000 1.000 | 1.000 |
||||||||
| Plot | Lyso | Other | |||||||||||
| Expt D |
1 peptide |
3 spectra |
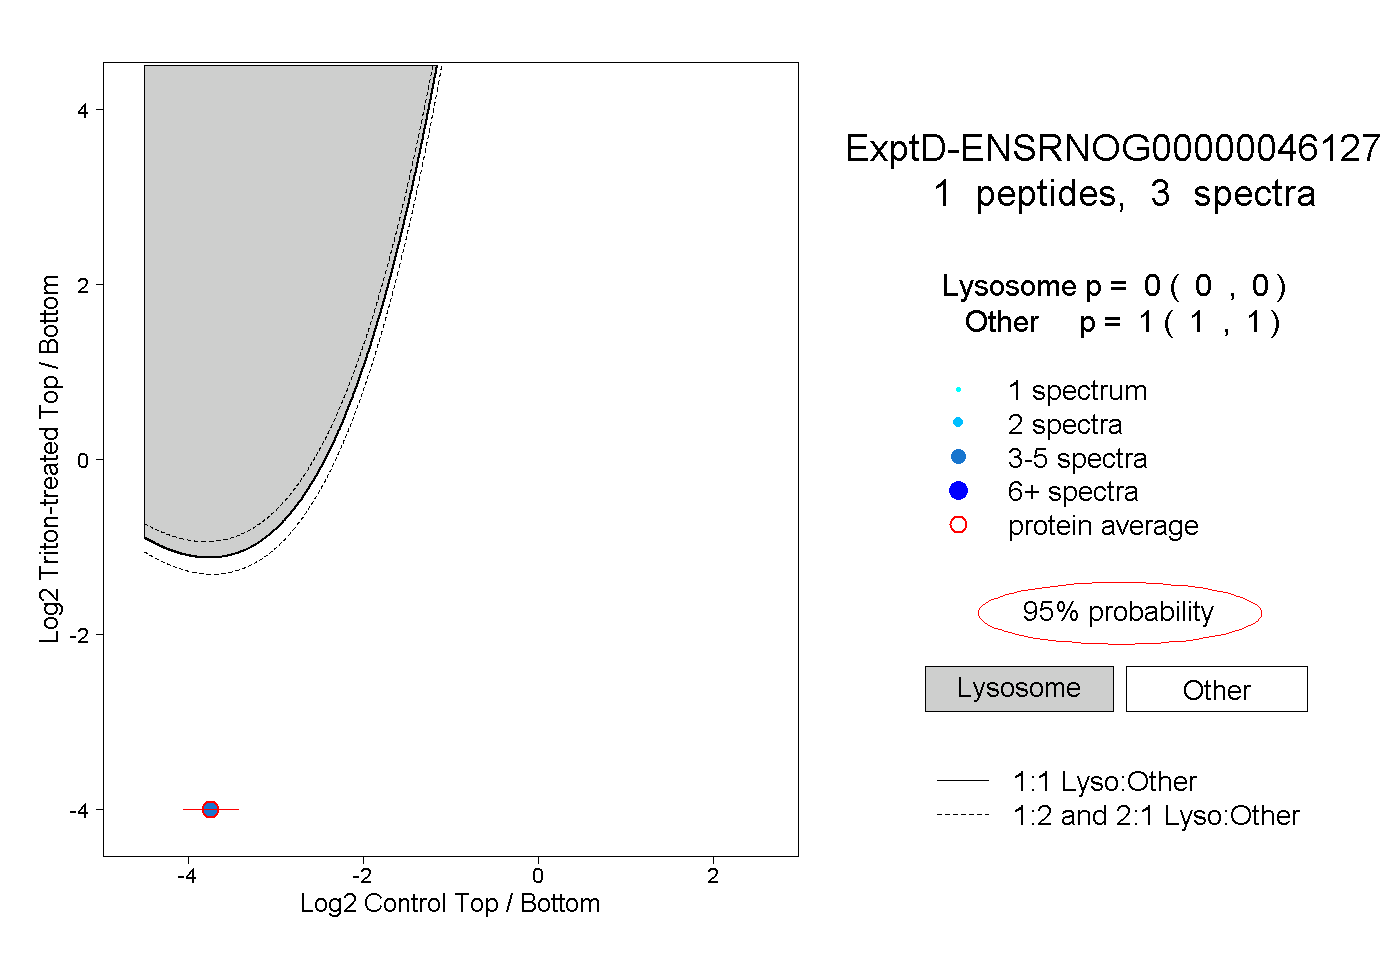 |
0.000 0.000 | 0.000 |
1.000 1.000 | 1.000 |