 6
6peptides
spectra
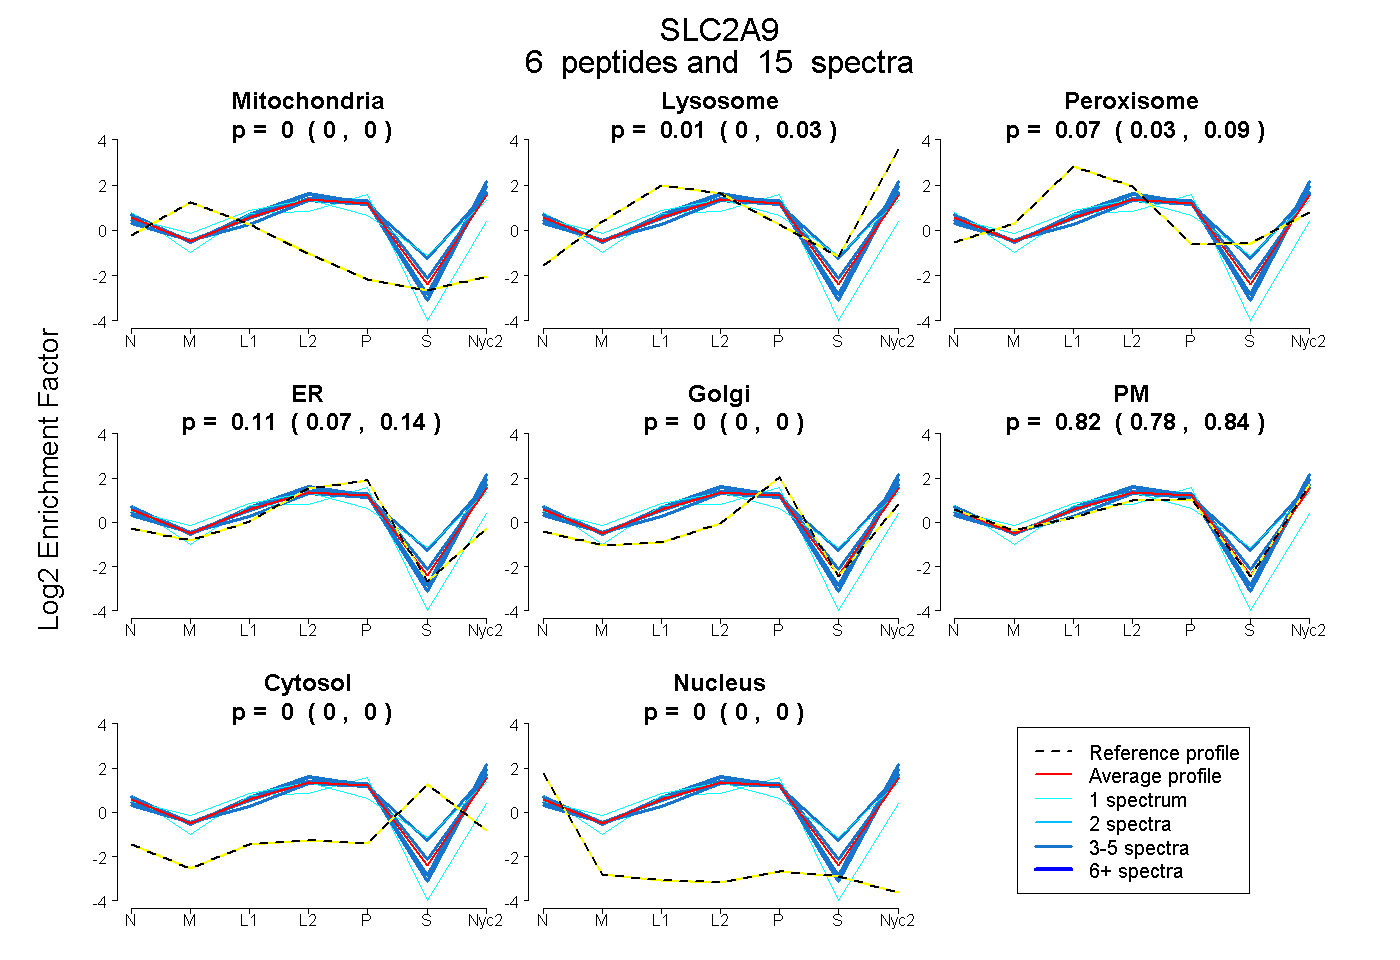
0.000 | 0.000
0.000 | 0.033
0.034 | 0.090
0.075 | 0.137
0.000 | 0.000
0.780 | 0.843
0.000 | 0.000
0.000 | 0.000
2peptides
spectra
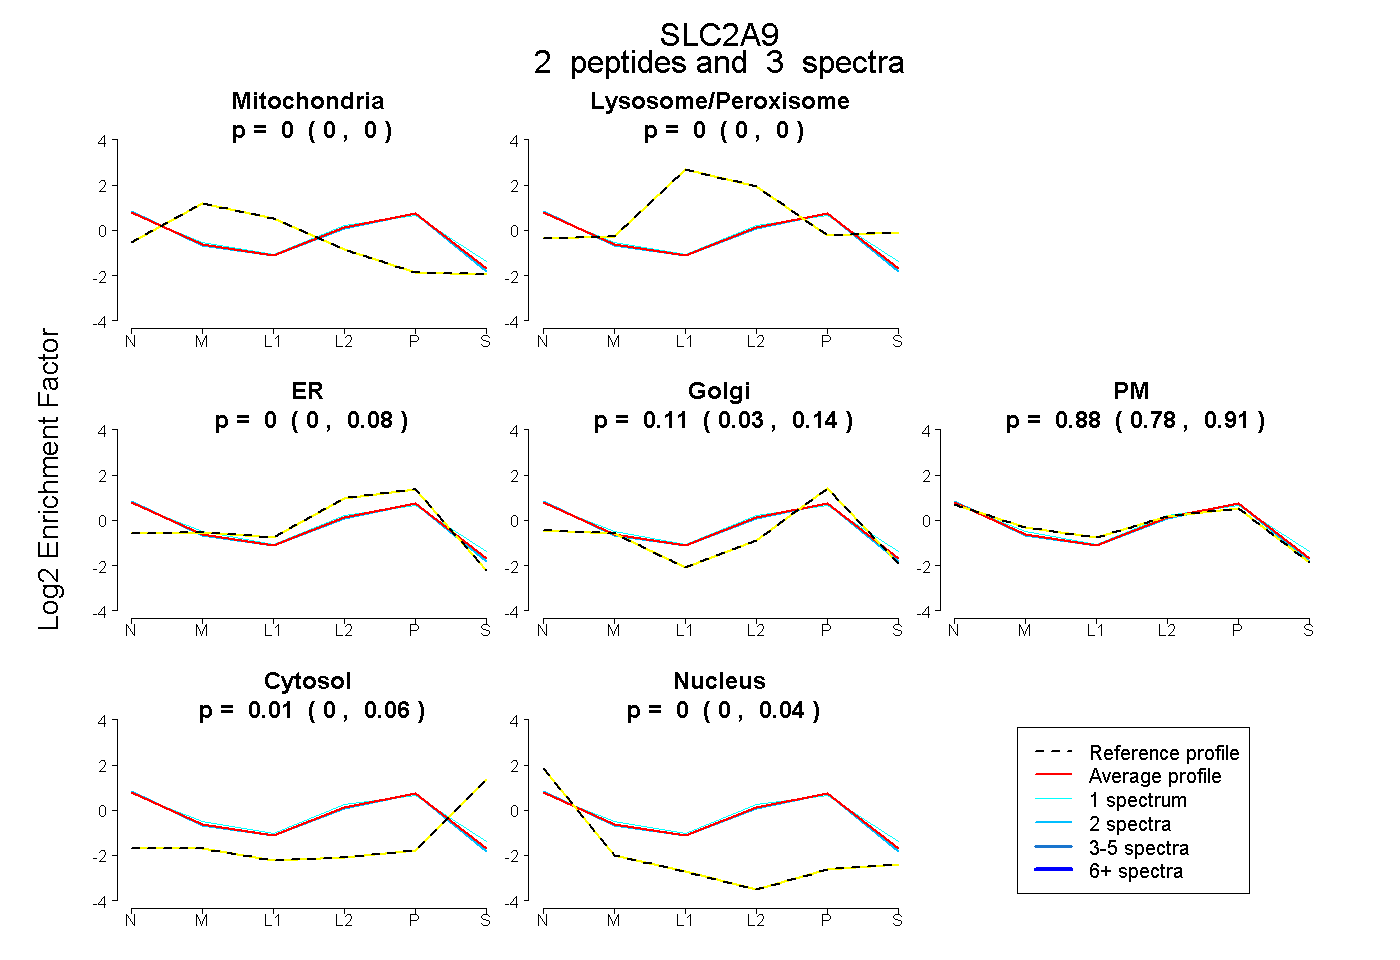
0.000 | 0.000
0.000 | 0.000
0.000 | 0.078
0.028 | 0.140
0.778 | 0.914
0.000 | 0.060
0.000 | 0.035
7peptides
spectra
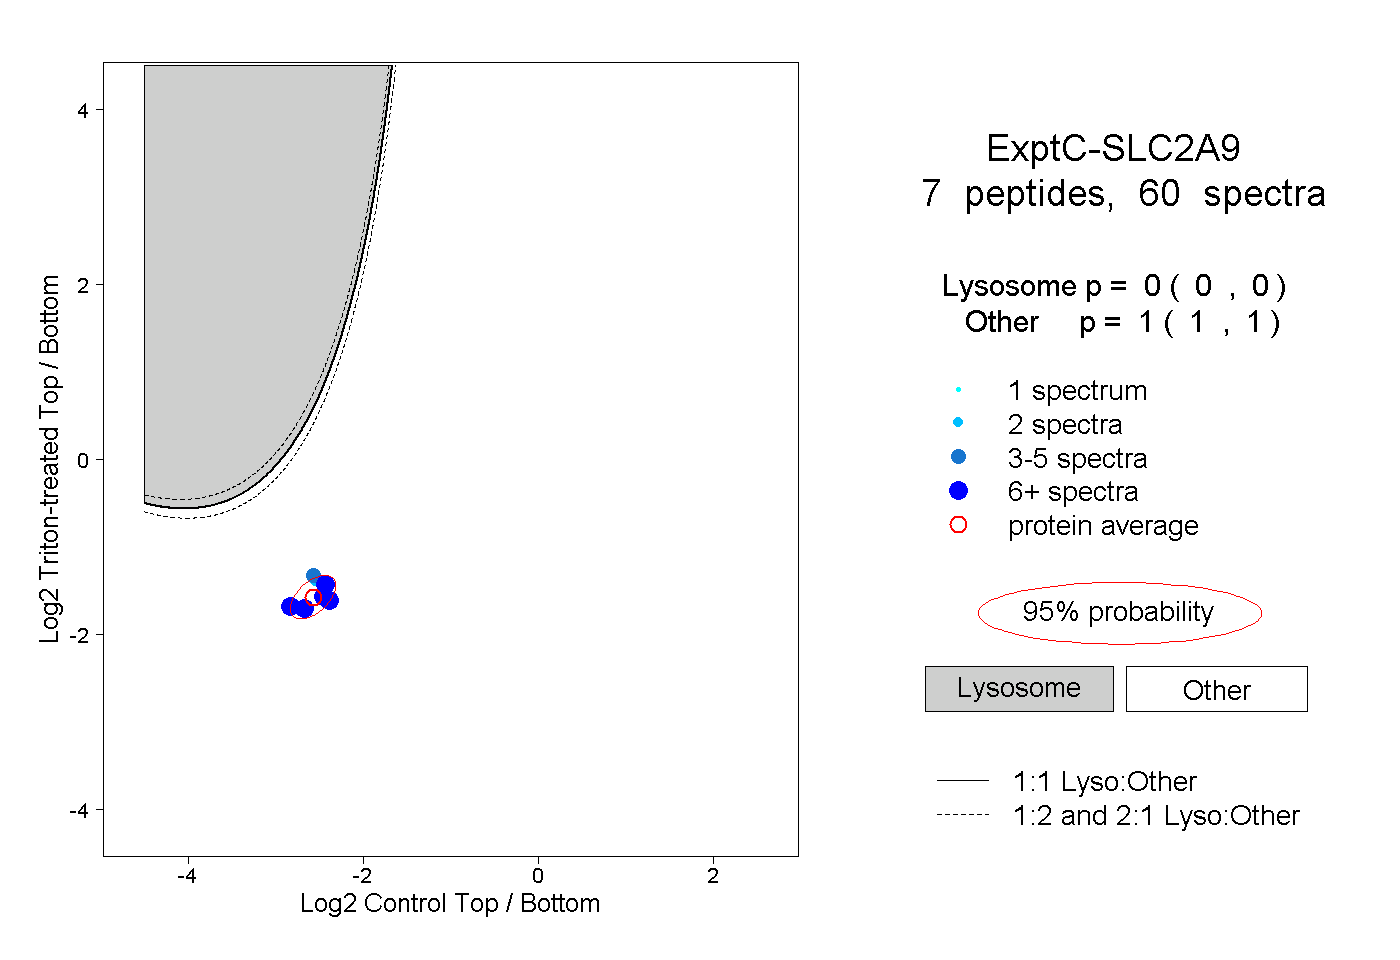
0.000 | 0.000
1.000 | 1.000
4peptides
spectra
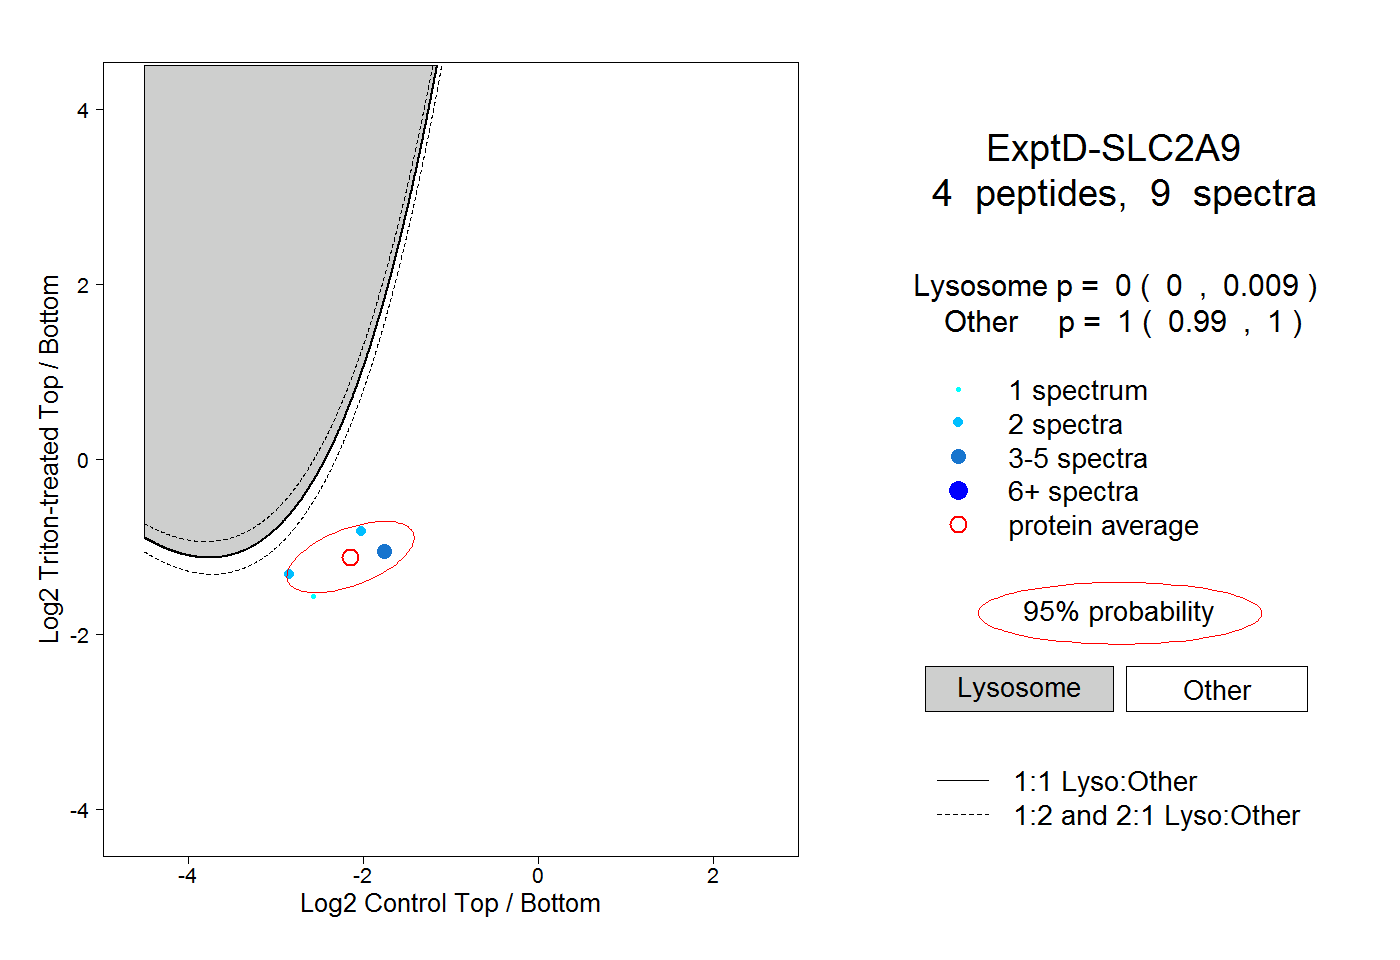
0.000 | 0.009
0.990 | 1.000