SLC2A9
[ENSRNOP00000045713]
Main page
| | | Plot |
Mito |
Lyso |
|
Perox |
ER |
Golgi |
PM |
Cytosol |
Nucleus |
|
| Expt A |
 6
6
peptides |
15
spectra |
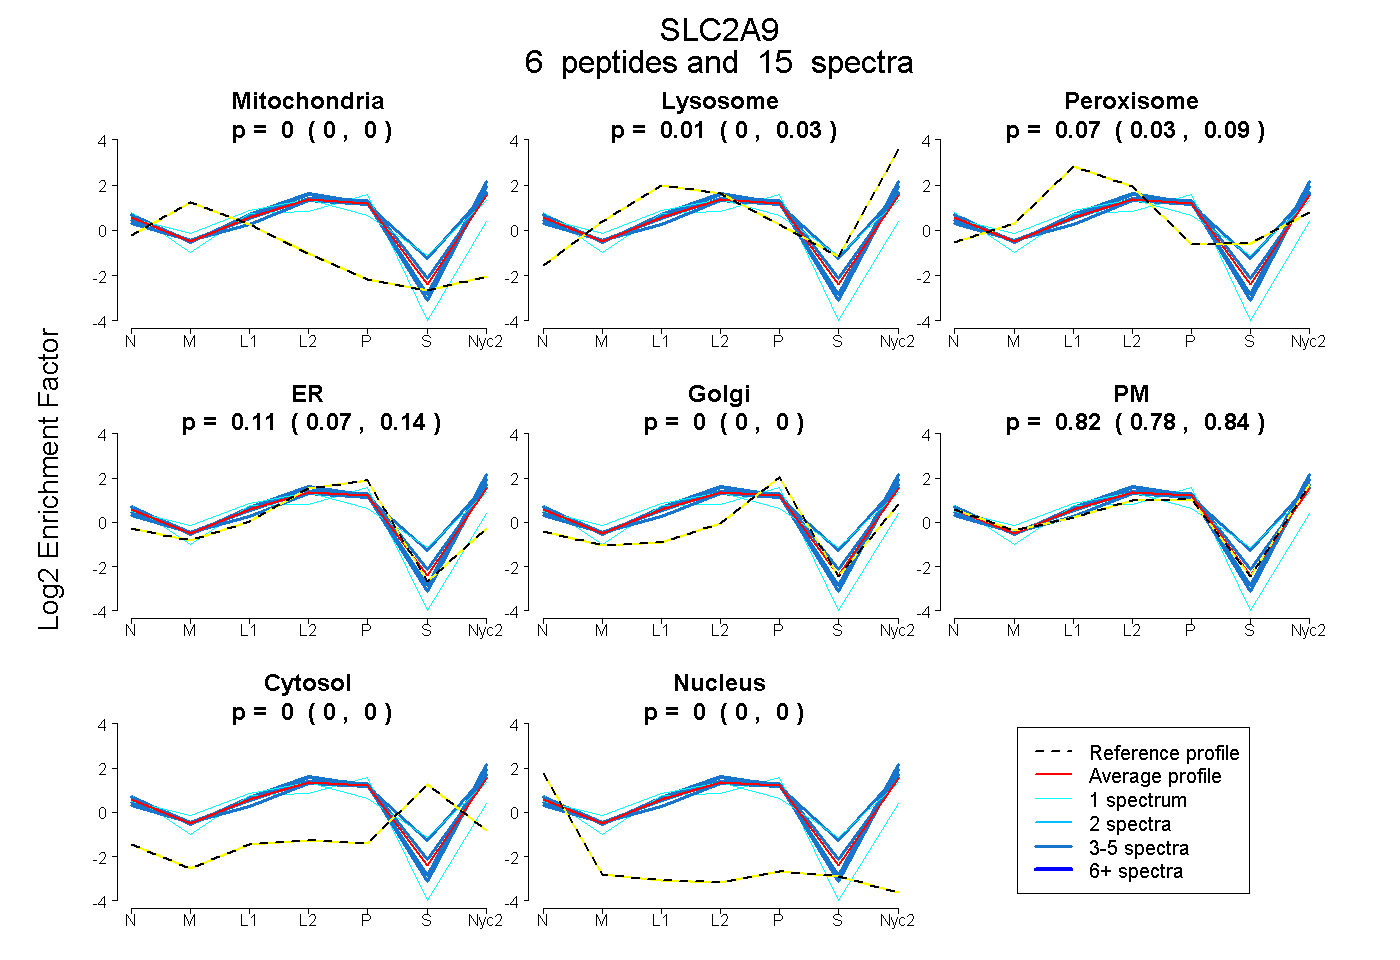 |
0.000
0.000 | 0.000 |
0.008
0.000 | 0.033 |
|
0.067
0.034 | 0.090 |
0.106
0.075 | 0.137 |
0.000
0.000 | 0.000 |
0.818
0.780 | 0.843 |
0.000
0.000 | 0.000 |
0.000
0.000 | 0.000 |
|
| | | Plot |
Mito |
|
Lyso or Perox |
|
ER |
Golgi |
PM |
Cytosol |
Nucleus |
|
| Expt B |
2
peptides |
3
spectra |
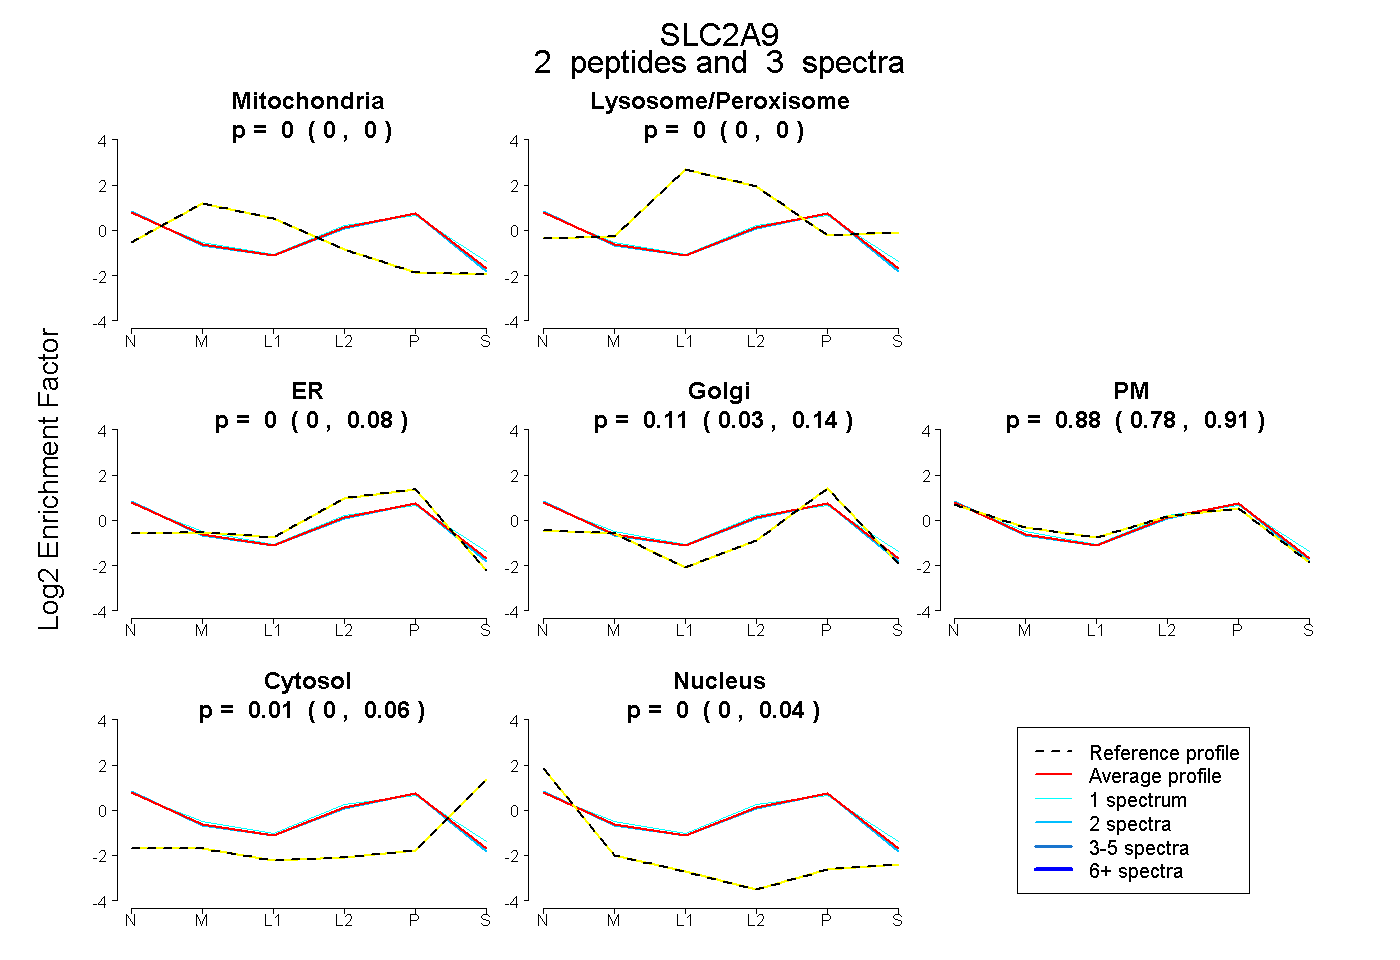 |
0.000
0.000 | 0.000 |
|
0.000
0.000 | 0.000 |
|
0.000
0.000 | 0.078 |
0.107
0.028 | 0.140 |
0.879
0.778 | 0.914 |
0.010
0.000 | 0.060 |
0.004
0.000 | 0.035 |
|
| | | Plot |
|
Lyso |
|
|
|
|
|
|
|
Other |
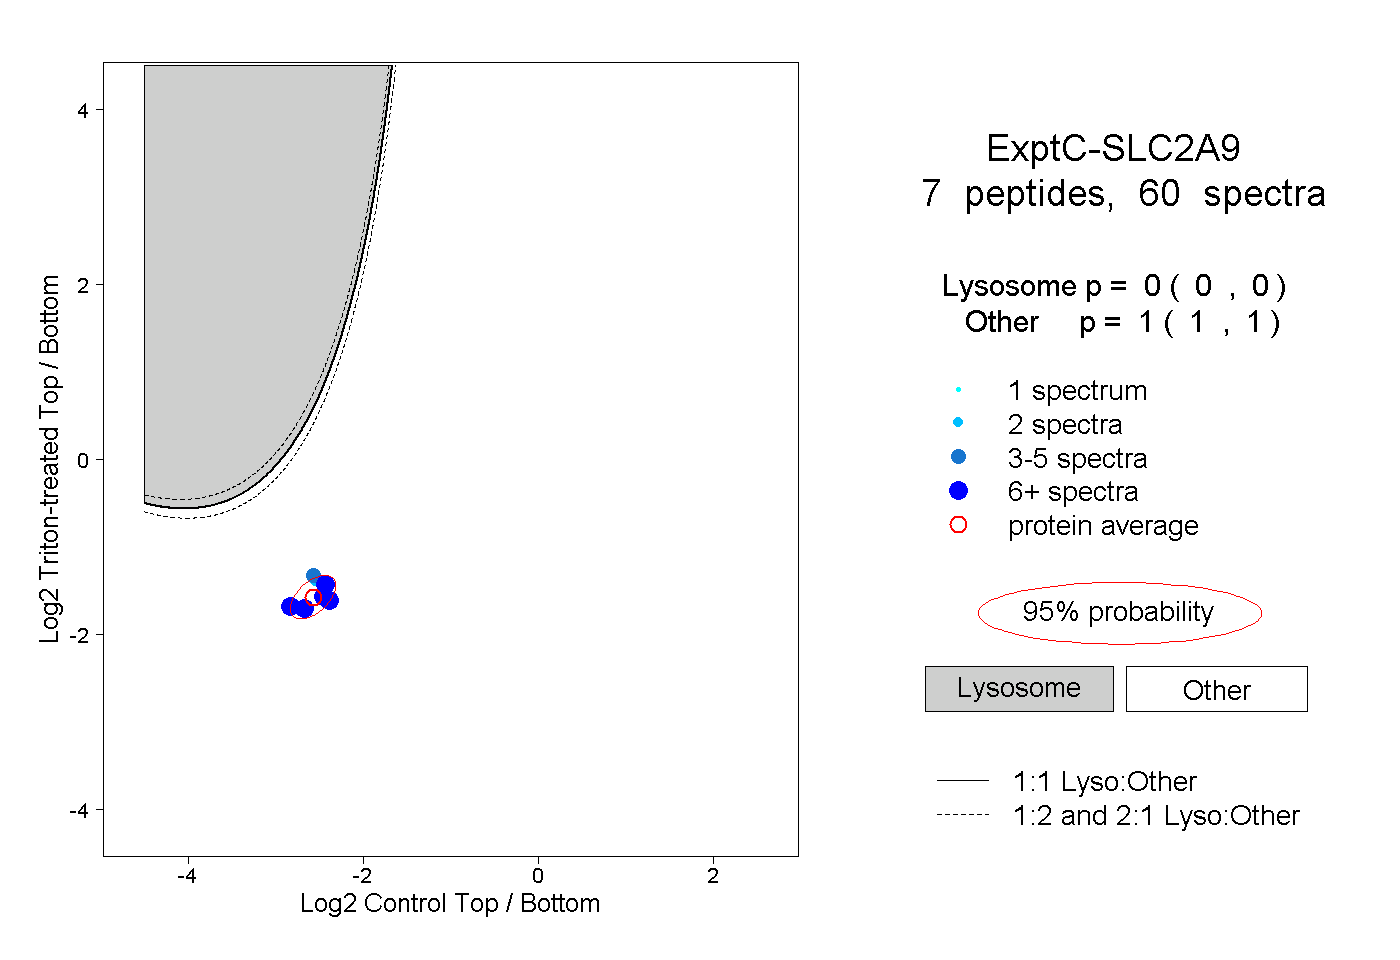
| Expt C |
7
peptides |
60
spectra |
 |
|
0.000
0.000 | 0.000 |
|
|
|
|
|
|
|
1.000
1.000 | 1.000 |
| 9 spectra, HDEAGATK |
|
0.000 |
|
|
|
|
|
|
|
1.000 |
| 14 spectra, ADSAMAEEK |
|
0.000 |
|
|
|
|
|
|
|
1.000 |
| 5 spectra, LVSVFELLR |
|
0.000 |
|
|
|
|
|
|
|
1.000 |
| 2 spectra, AGVPQDK |
|
0.000 |
|
|
|
|
|
|
|
1.000 |
| 16 spectra, AHPPEVK |
|
0.000 |
|
|
|
|
|
|
|
1.000 |
| 8 spectra, YLLFEK |
|
0.000 |
|
|
|
|
|
|
|
1.000 |
| 6 spectra, AFQTFLGK |
|
0.000 |
|
|
|
|
|
|
|
1.000 |
| | | Plot |
|
Lyso |
|
|
|
|
|
|
|
Other |
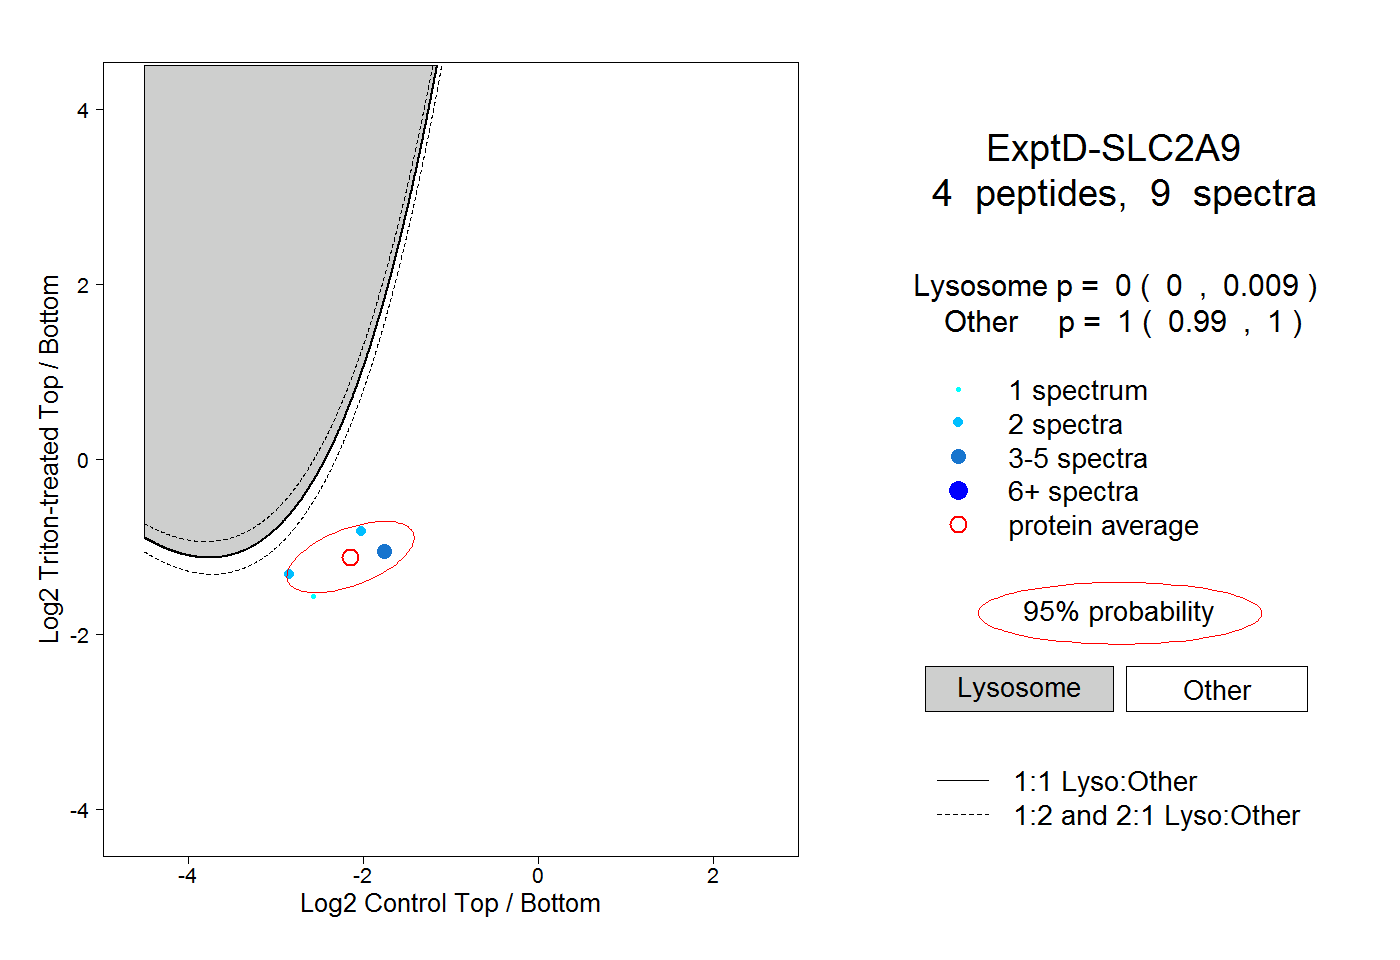
| Expt D |
4
peptides |
9
spectra |
 |
|
0.000
0.000 | 0.009 |
|
|
|
|
|
|
|
1.000
0.990 | 1.000 |