 10
10peptides
spectra
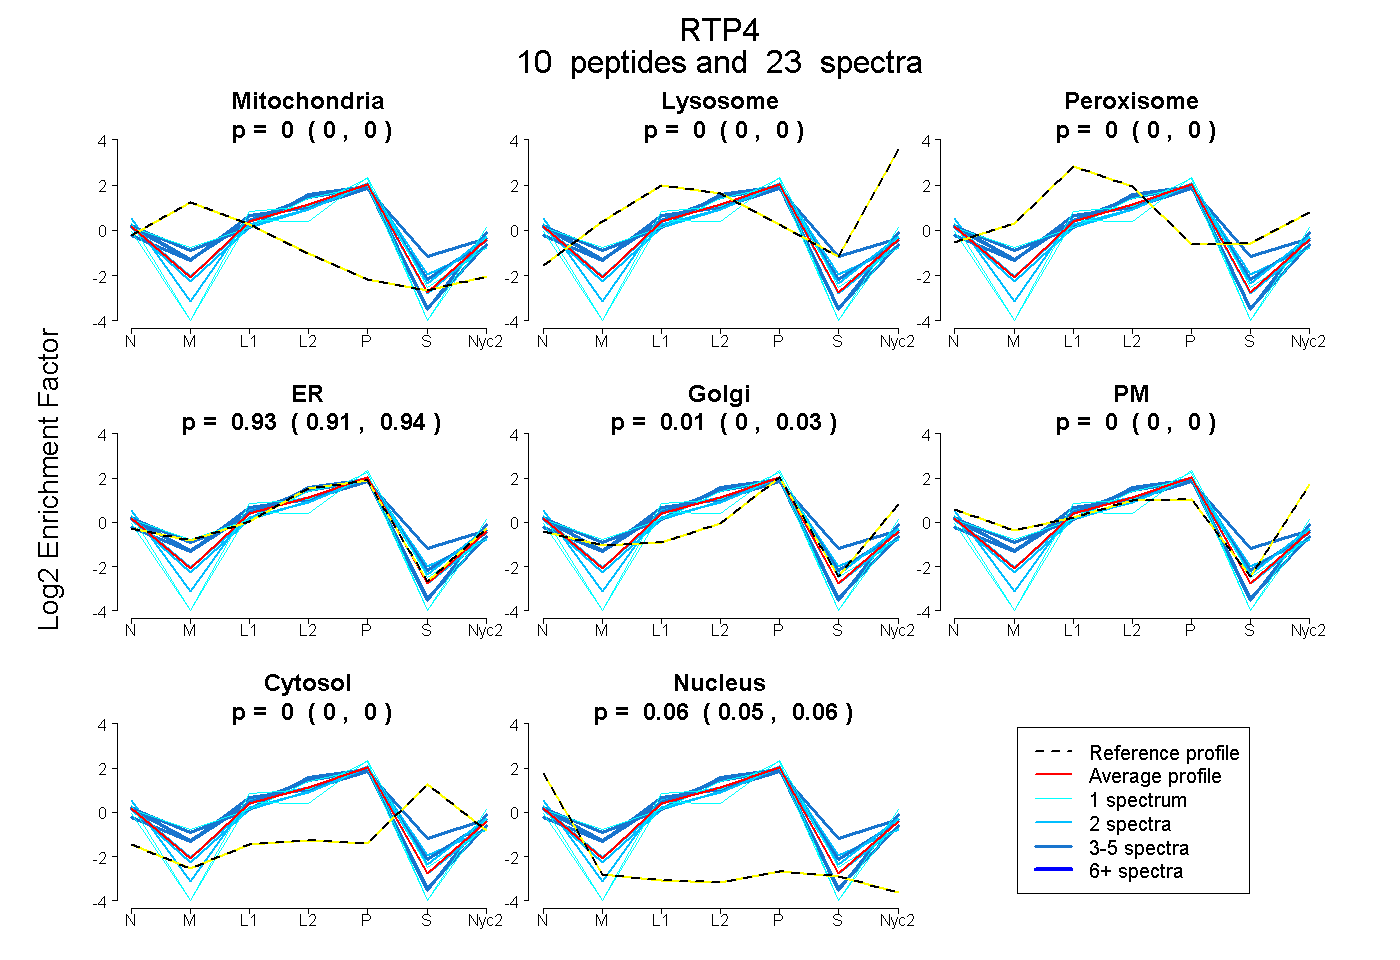
0.000 | 0.000
0.000 | 0.000
0.000 | 0.000
0.912 | 0.943
0.000 | 0.027
0.000 | 0.000
0.000 | 0.000
0.053 | 0.064
5peptides
spectra
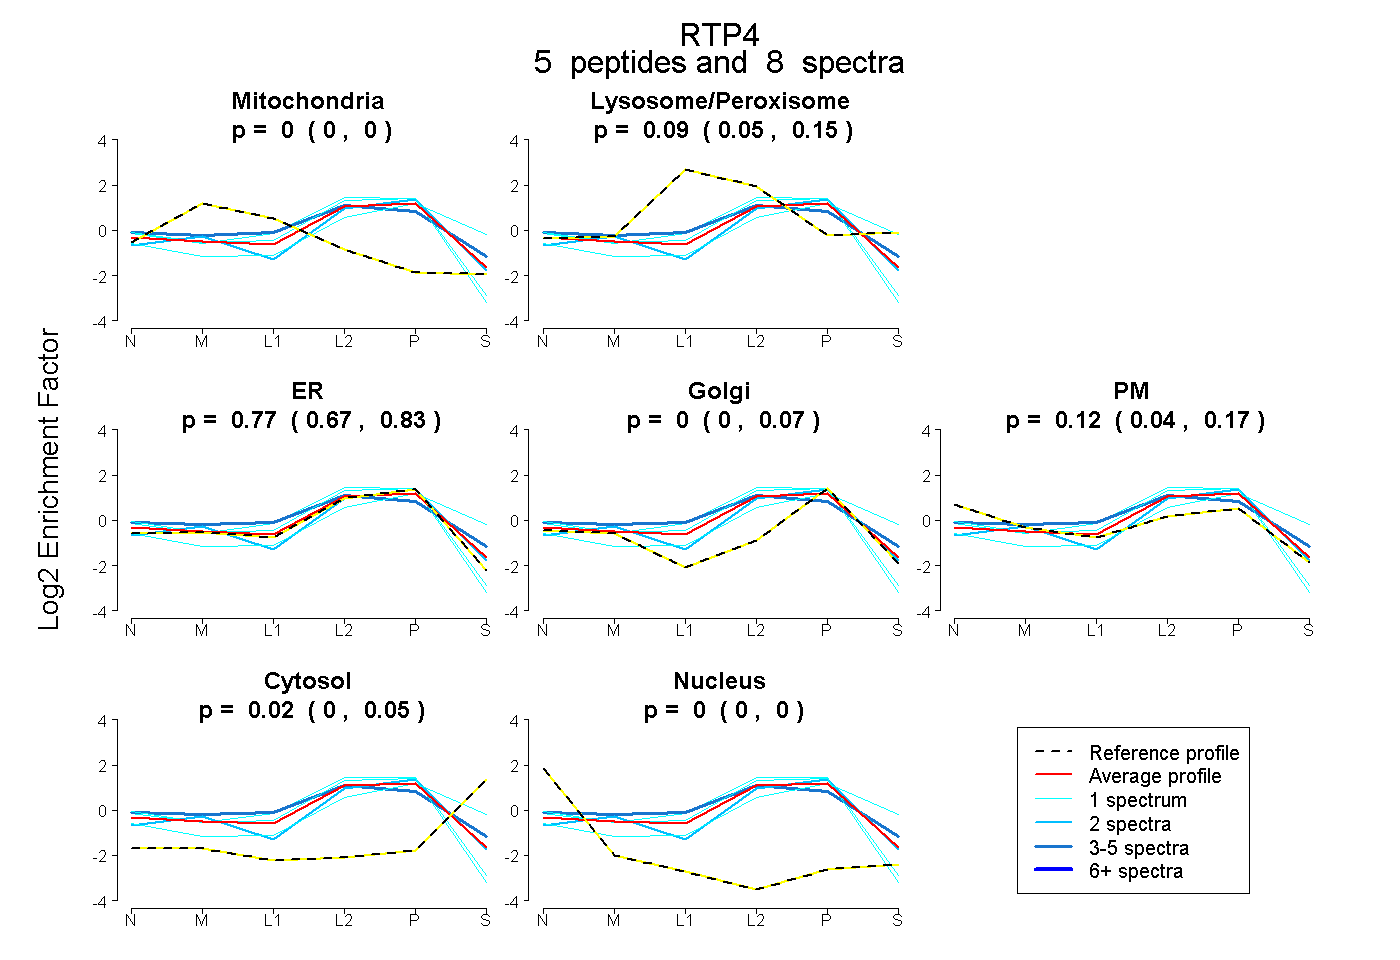
0.000 | 0.000
0.047 | 0.150
0.666 | 0.830
0.000 | 0.073
0.042 | 0.167
0.000 | 0.046
0.000 | 0.000
11peptides
spectra
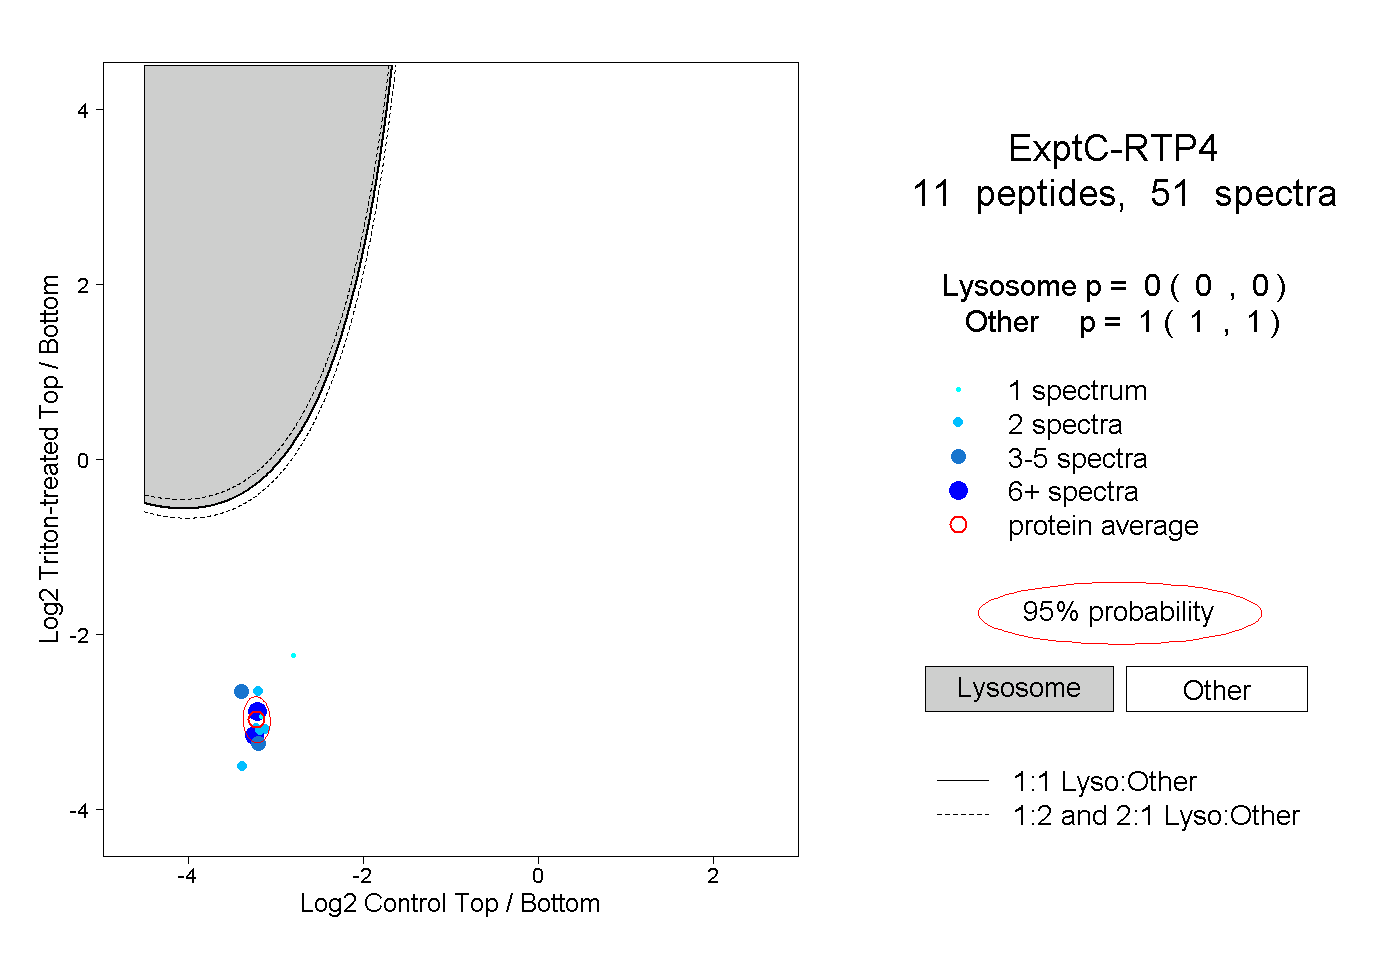
0.000 | 0.000
1.000 | 1.000
3peptides
spectra
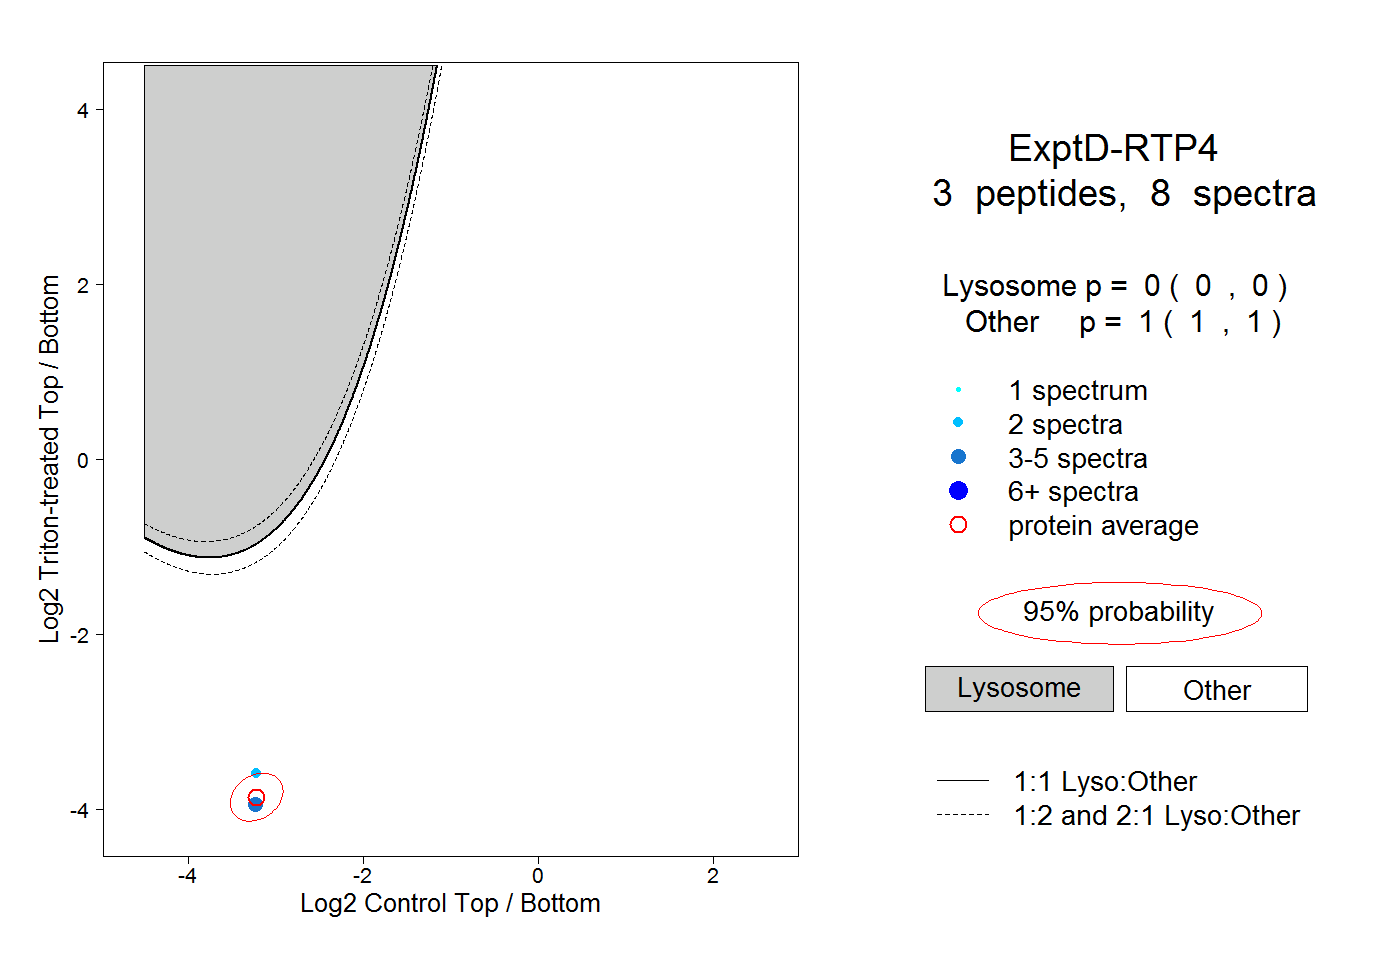
0.000 | 0.000
1.000 | 1.000