 10
10peptides
spectra
0.000 | 0.000
0.000 | 0.000
0.000 | 0.000
0.912 | 0.943
0.000 | 0.027
0.000 | 0.000
0.000 | 0.000
0.053 | 0.064
| Plot | Mito | Lyso | Perox | ER | Golgi | PM | Cytosol | Nucleus | |||||
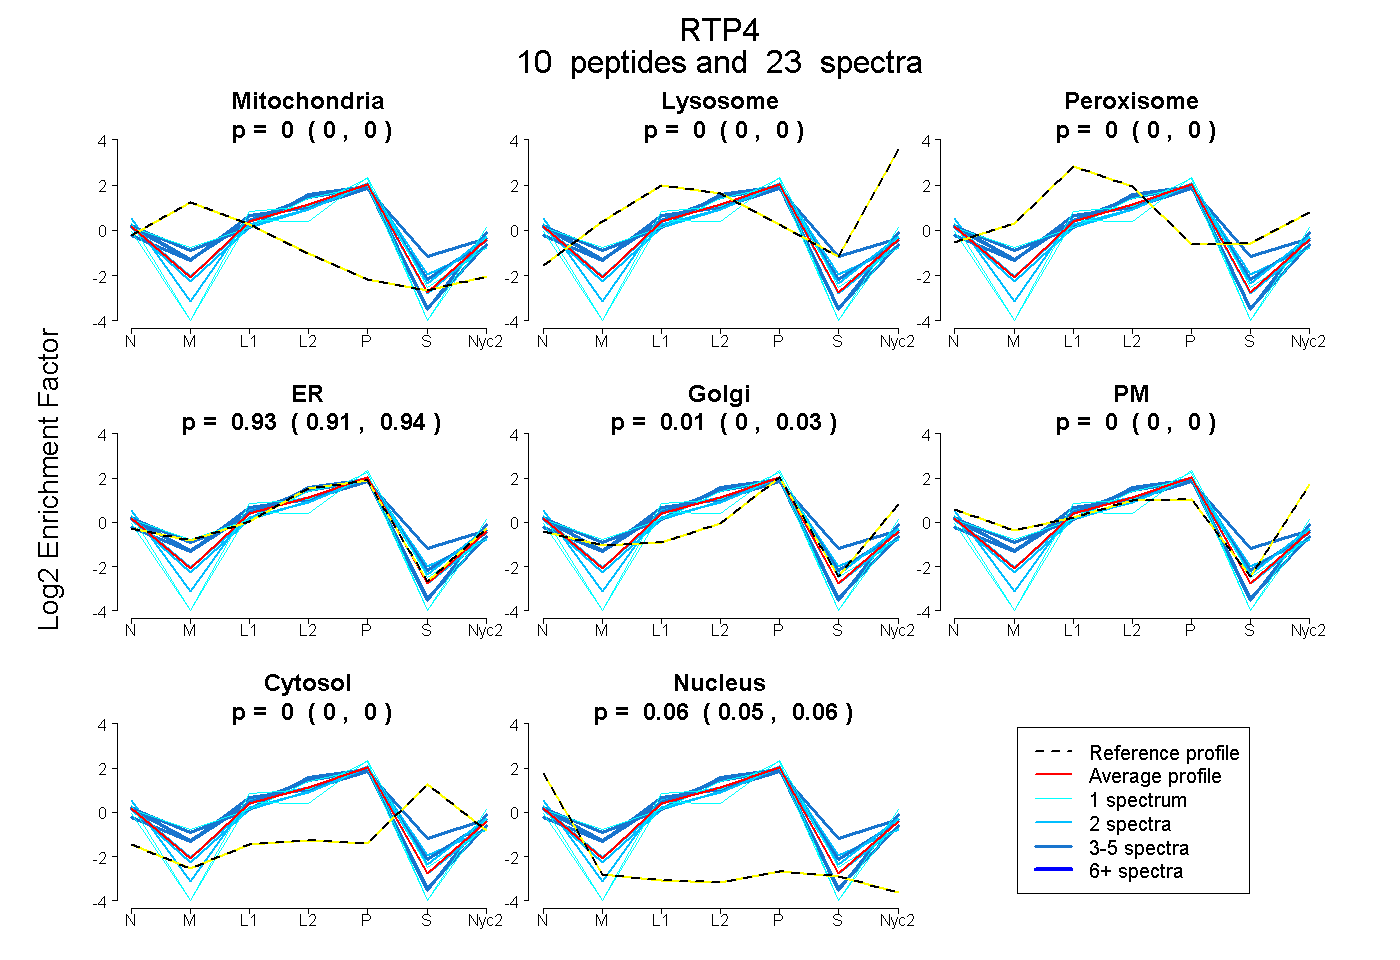
| Expt A |
10 peptides |
23 spectra |
|
0.000 0.000 | 0.000 |
0.000 0.000 | 0.000 |
0.000 0.000 | 0.000 |
0.931 0.912 | 0.943 |
0.010 0.000 | 0.027 |
0.000 0.000 | 0.000 |
0.000 0.000 | 0.000 |
0.059 0.053 | 0.064 |
| 1 spectrum, WTLHLDK | 0.000 | 0.000 | 0.000 | 0.961 | 0.000 | 0.021 | 0.000 | 0.018 | ||
| 3 spectra, NIVPDGAALGWR | 0.000 | 0.000 | 0.054 | 0.905 | 0.000 | 0.000 | 0.031 | 0.010 | ||
| 4 spectra, FQELIR | 0.000 | 0.000 | 0.000 | 0.909 | 0.000 | 0.086 | 0.000 | 0.004 | ||
| 1 spectrum, SHPPLLQTEITGFR | 0.000 | 0.000 | 0.000 | 0.690 | 0.139 | 0.000 | 0.073 | 0.098 | ||
| 4 spectra, QQQQTVVGR | 0.000 | 0.000 | 0.000 | 0.967 | 0.000 | 0.000 | 0.000 | 0.033 | ||
| 2 spectra, CAVAQR | 0.000 | 0.000 | 0.000 | 0.842 | 0.000 | 0.000 | 0.110 | 0.048 | ||
| 3 spectra, MLFSDDFSTWEQR | 0.000 | 0.000 | 0.127 | 0.719 | 0.000 | 0.000 | 0.154 | 0.000 | ||
| 2 spectra, IASILNASLDEK | 0.000 | 0.000 | 0.000 | 0.895 | 0.000 | 0.000 | 0.000 | 0.105 | ||
| 1 spectrum, SPSPSPSPSPK | 0.000 | 0.000 | 0.000 | 0.824 | 0.122 | 0.000 | 0.000 | 0.054 | ||
| 2 spectra, NRPFQEVR | 0.000 | 0.000 | 0.000 | 0.781 | 0.137 | 0.000 | 0.039 | 0.043 |
| Plot | Mito | Lyso or Perox | ER | Golgi | PM | Cytosol | Nucleus | ||||||
| Expt B |
5 peptides |
8 spectra |
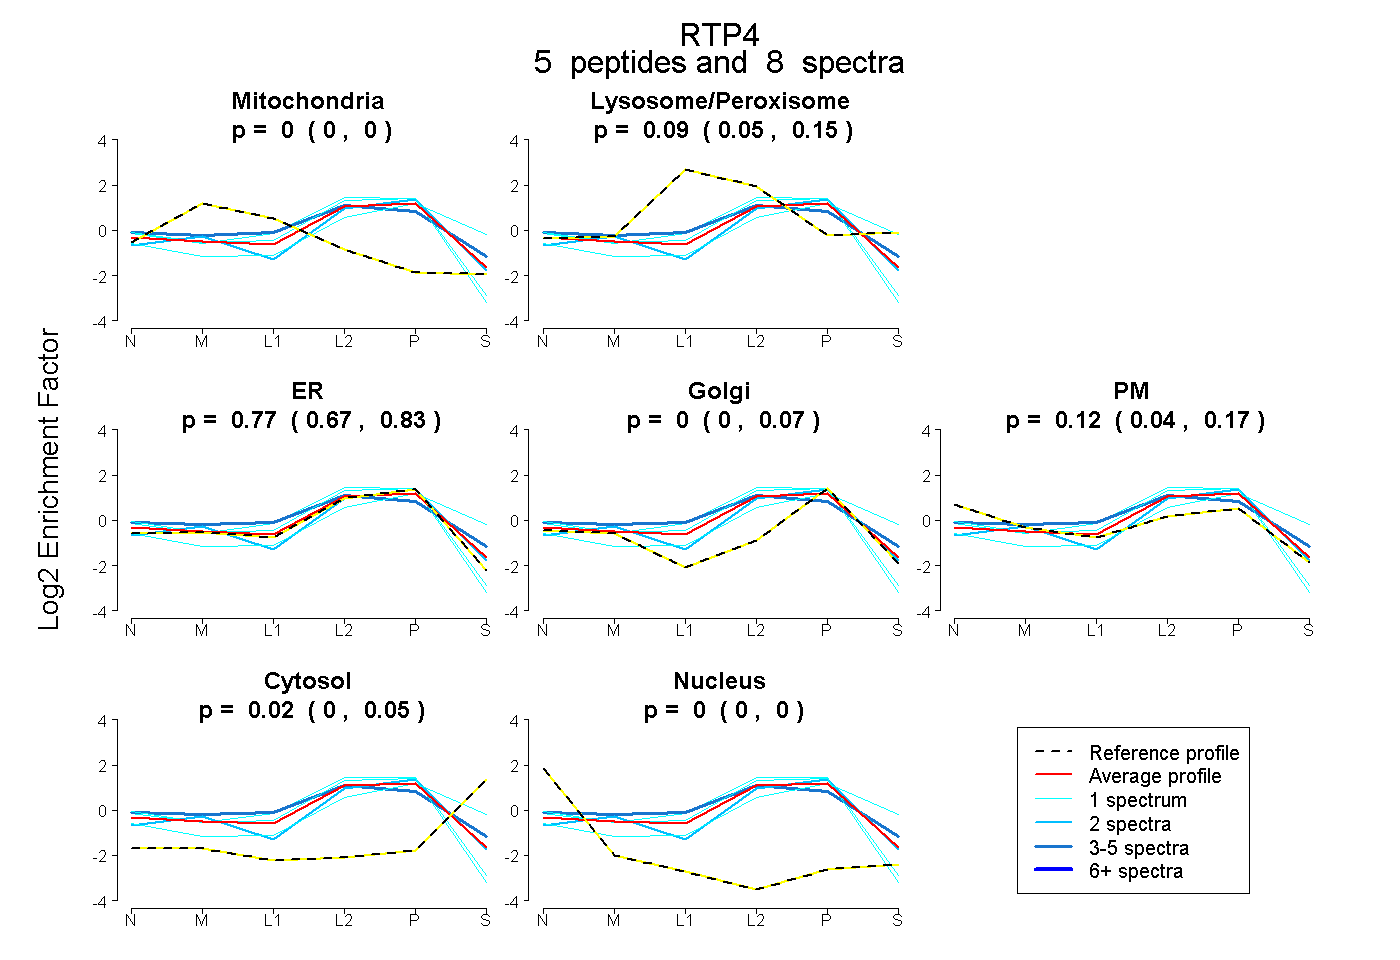 |
0.000 0.000 | 0.000 |
0.095 0.047 | 0.150 |
0.769 0.666 | 0.830 |
0.000 0.000 | 0.073 |
0.116 0.042 | 0.167 |
0.021 0.000 | 0.046 |
0.000 0.000 | 0.000 |
|||
| Plot | Lyso | Other | |||||||||||
| Expt C |
11 peptides |
51 spectra |
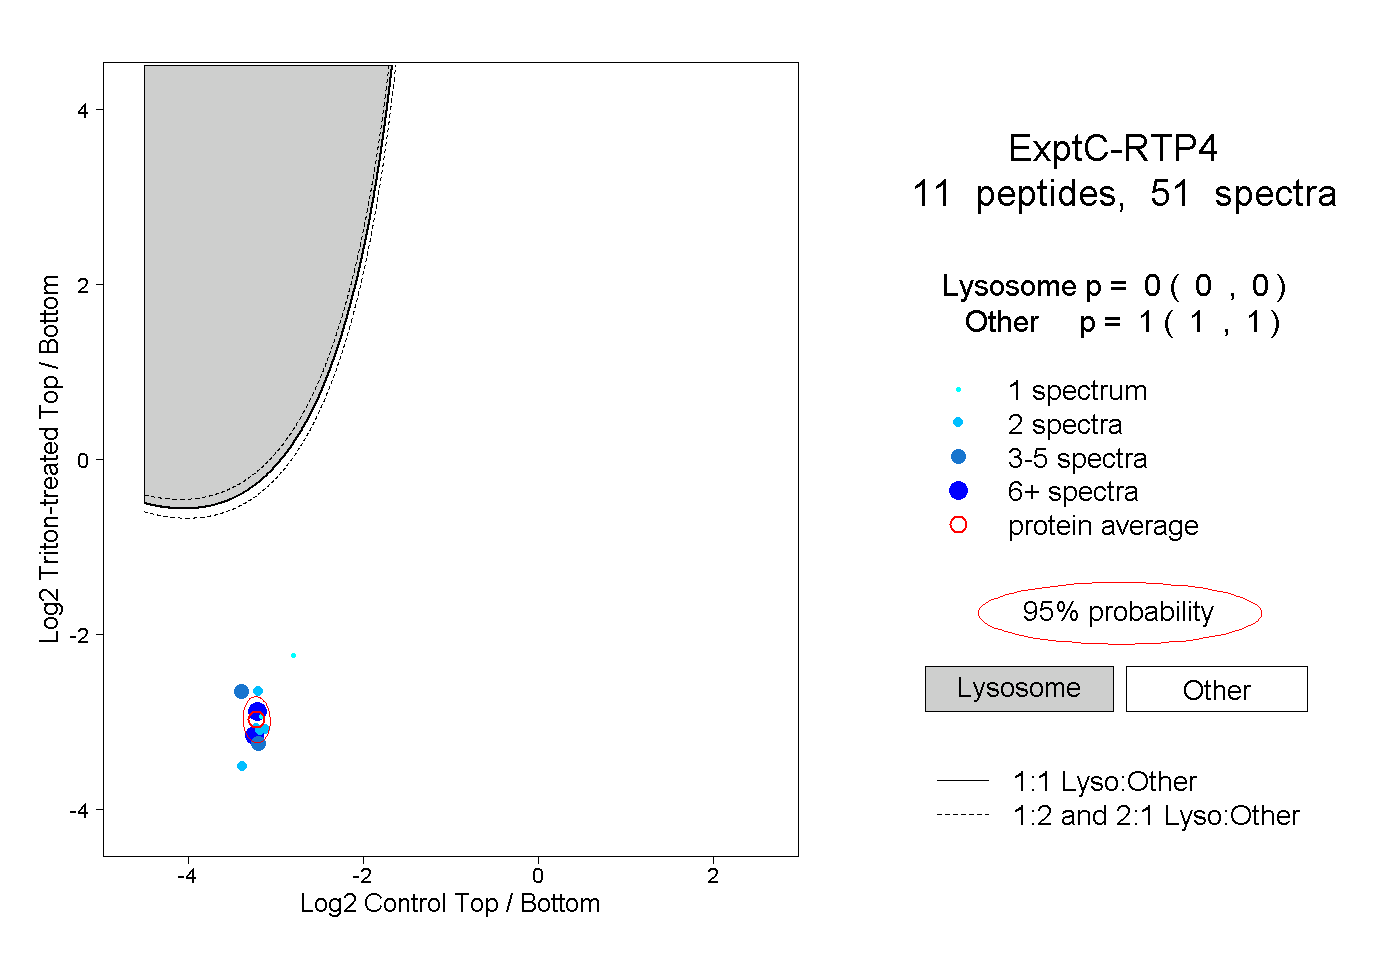 |
0.000 0.000 | 0.000 |
1.000 1.000 | 1.000 |
||||||||
| Plot | Lyso | Other | |||||||||||
| Expt D |
3 peptides |
8 spectra |
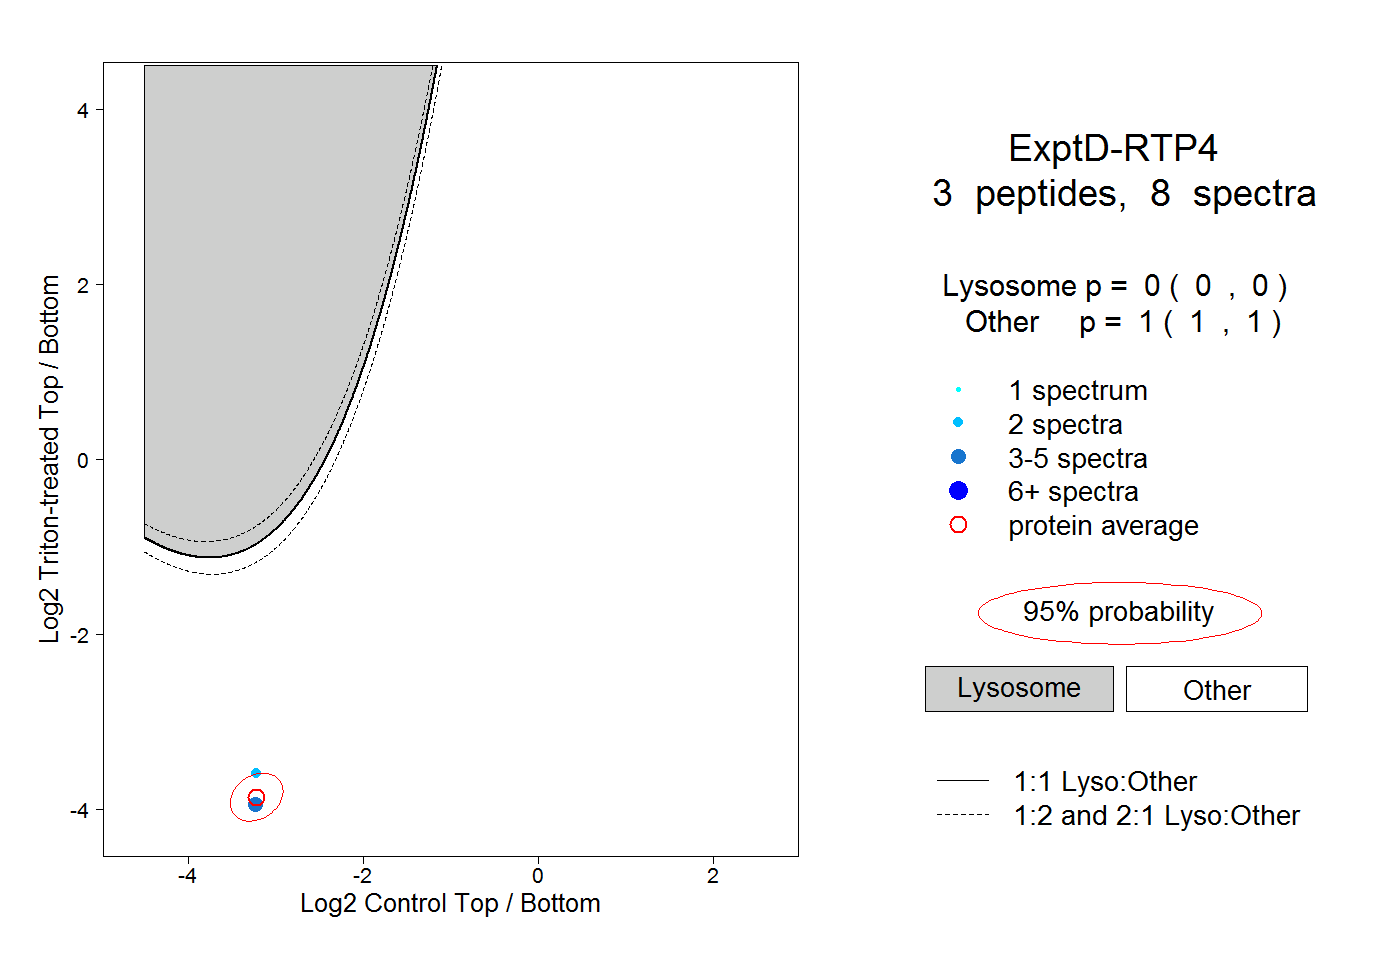 |
0.000 0.000 | 0.000 |
1.000 1.000 | 1.000 |