 12
12peptides
spectra
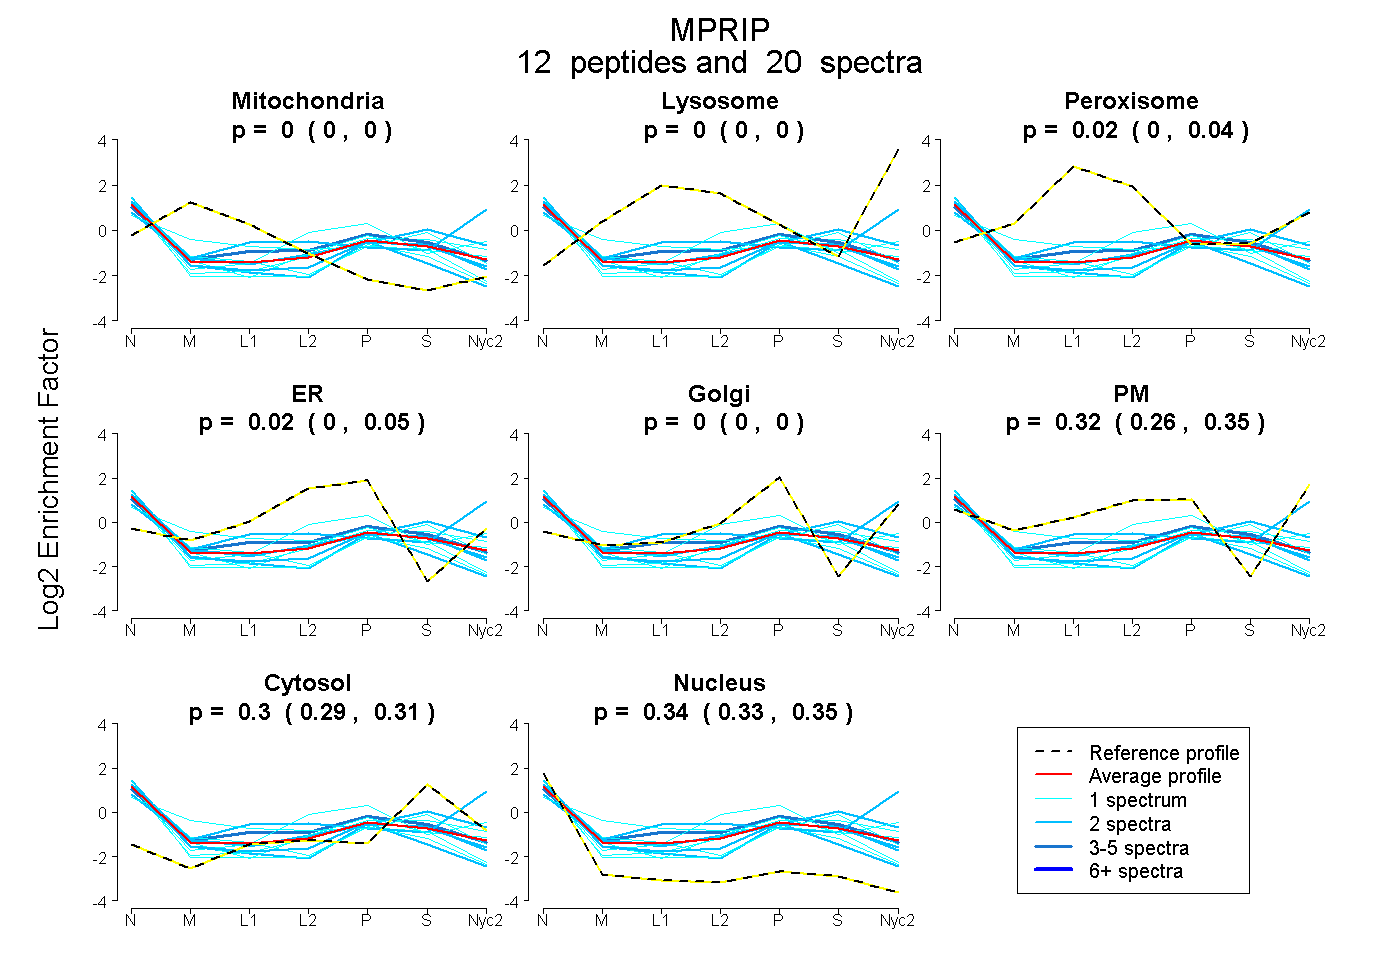
0.000 | 0.000
0.000 | 0.000
0.001 | 0.038
0.000 | 0.047
0.000 | 0.000
0.265 | 0.352
0.287 | 0.313
0.328 | 0.353
1peptide
spectrum
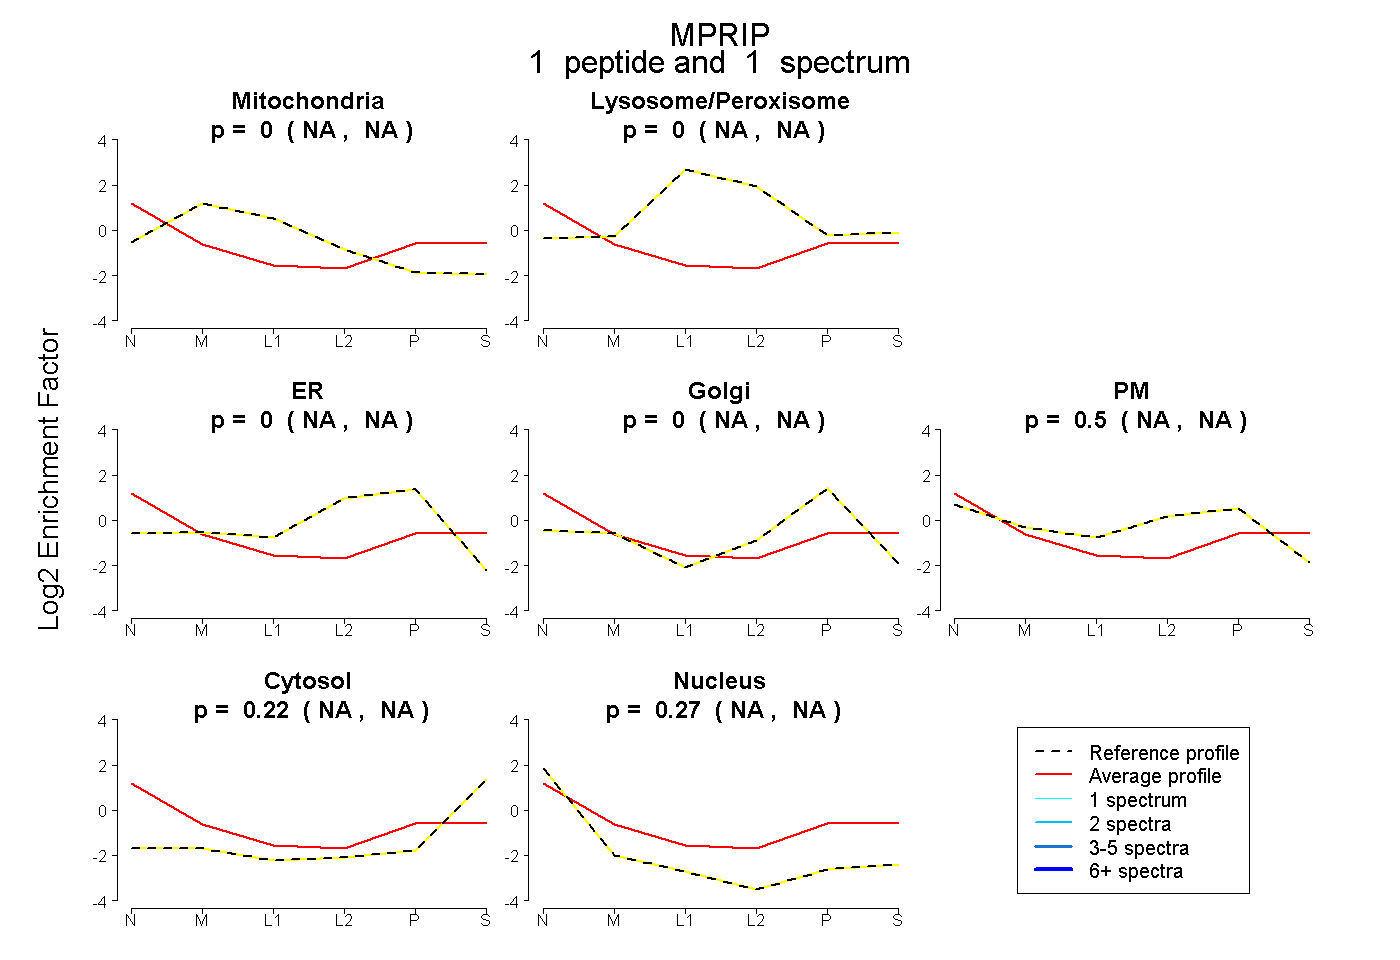
NA | NA
NA | NA
NA | NA
NA | NA
NA | NA
NA | NA
NA | NA
3peptides
spectra
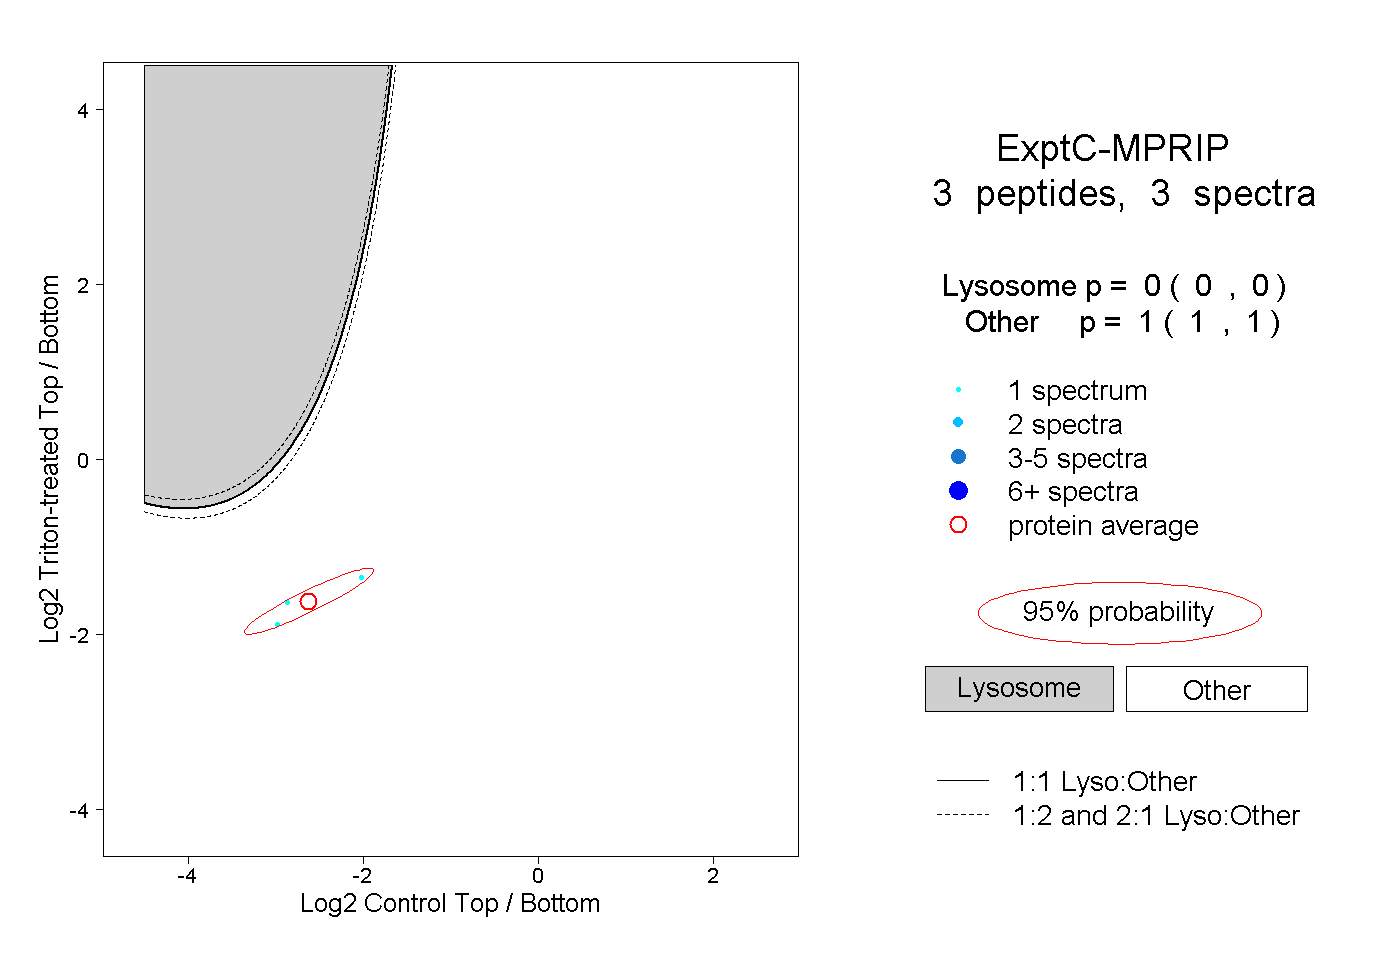
0.000 | 0.000
1.000 | 1.000