 12
12peptides
spectra
0.000 | 0.000
0.000 | 0.000
0.001 | 0.038
0.000 | 0.047
0.000 | 0.000
0.265 | 0.352
0.287 | 0.313
0.328 | 0.353
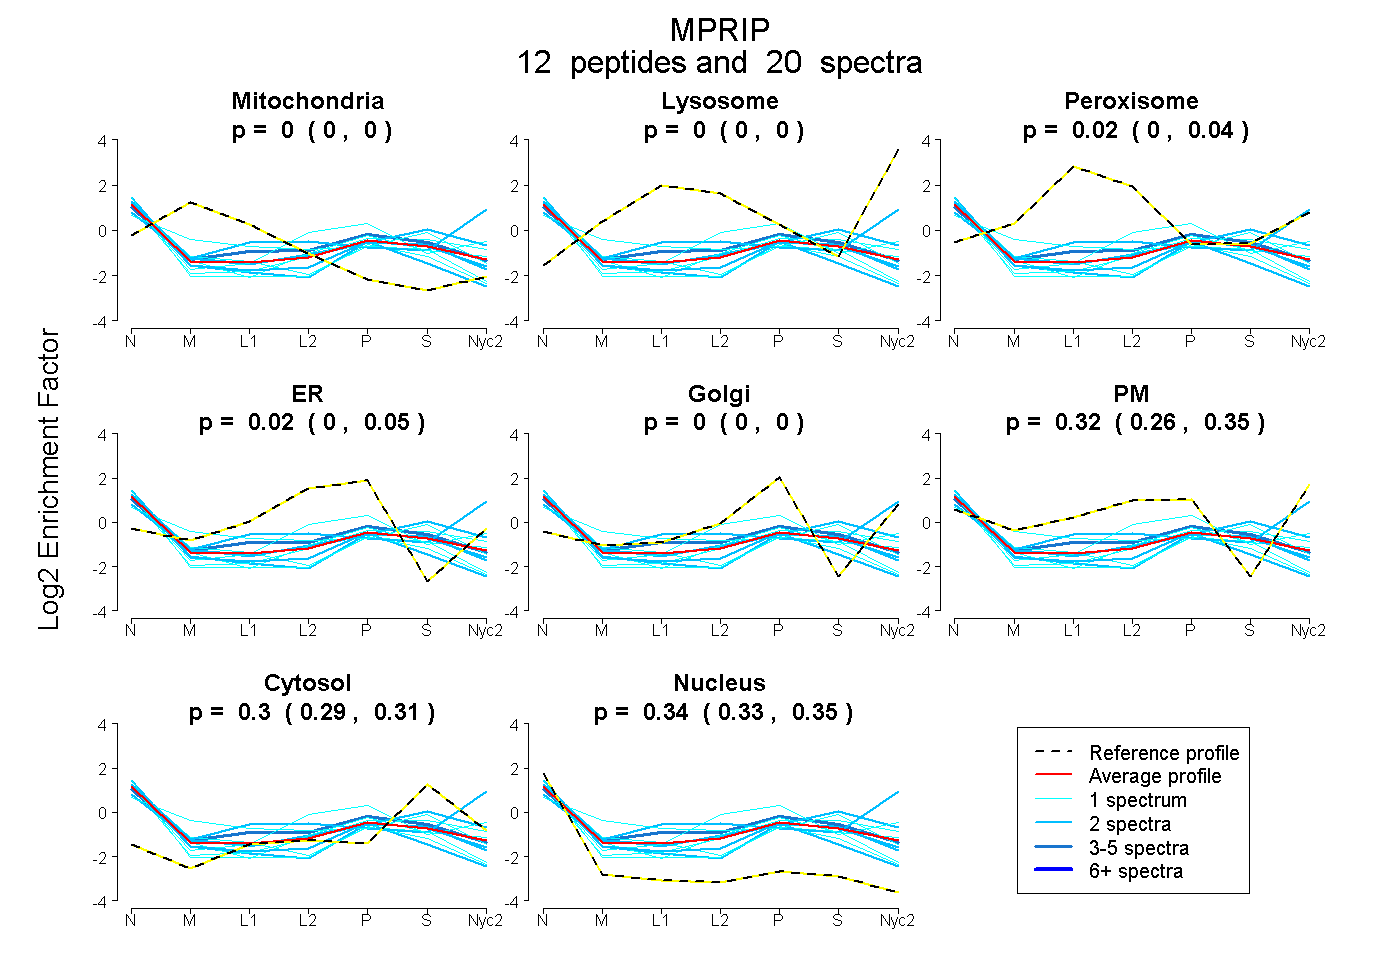
| Plot | Mito | Lyso | Perox | ER | Golgi | PM | Cytosol | Nucleus | |||||
| Expt A |
12 peptides |
20 spectra |
|
0.000 0.000 | 0.000 |
0.000 0.000 | 0.000 |
0.020 0.001 | 0.038 |
0.015 0.000 | 0.047 |
0.000 0.000 | 0.000 |
0.321 0.265 | 0.352 |
0.301 0.287 | 0.313 |
0.342 0.328 | 0.353 |
| 2 spectra, DAYELEVLLR | 0.043 | 0.000 | 0.013 | 0.096 | 0.179 | 0.000 | 0.128 | 0.542 | ||
| 1 spectrum, EGYVLQATCER | 0.000 | 0.000 | 0.000 | 0.000 | 0.034 | 0.288 | 0.382 | 0.296 | ||
| 1 spectrum, LLQDQLR | 0.000 | 0.000 | 0.000 | 0.145 | 0.020 | 0.372 | 0.240 | 0.224 | ||
| 1 spectrum, ENQELNAHNQELNNR | 0.000 | 0.000 | 0.000 | 0.081 | 0.157 | 0.006 | 0.213 | 0.543 | ||
| 2 spectra, SQISSINSDIEALR | 0.000 | 0.000 | 0.000 | 0.000 | 0.076 | 0.222 | 0.302 | 0.400 | ||
| 2 spectra, CLENAHLAQALEAER | 0.001 | 0.000 | 0.074 | 0.124 | 0.000 | 0.147 | 0.281 | 0.373 | ||
| 4 spectra, ESEIQYLK | 0.000 | 0.000 | 0.114 | 0.143 | 0.000 | 0.162 | 0.282 | 0.298 | ||
| 2 spectra, FQANIFNK | 0.000 | 0.084 | 0.020 | 0.000 | 0.000 | 0.479 | 0.230 | 0.187 | ||
| 1 spectrum, FEALDIEK | 0.107 | 0.000 | 0.101 | 0.000 | 0.147 | 0.000 | 0.201 | 0.443 | ||
| 2 spectra, HWFVLADQSLR | 0.000 | 0.000 | 0.000 | 0.000 | 0.000 | 0.322 | 0.472 | 0.206 | ||
| 1 spectrum, NWIQTIMK | 0.223 | 0.000 | 0.127 | 0.031 | 0.000 | 0.107 | 0.357 | 0.155 | ||
| 1 spectrum, LLAEETAATISAIEAMK | 0.000 | 0.000 | 0.000 | 0.000 | 0.117 | 0.280 | 0.247 | 0.356 |
| Plot | Mito | Lyso or Perox | ER | Golgi | PM | Cytosol | Nucleus | ||||||
| Expt B |
1 peptide |
1 spectrum |
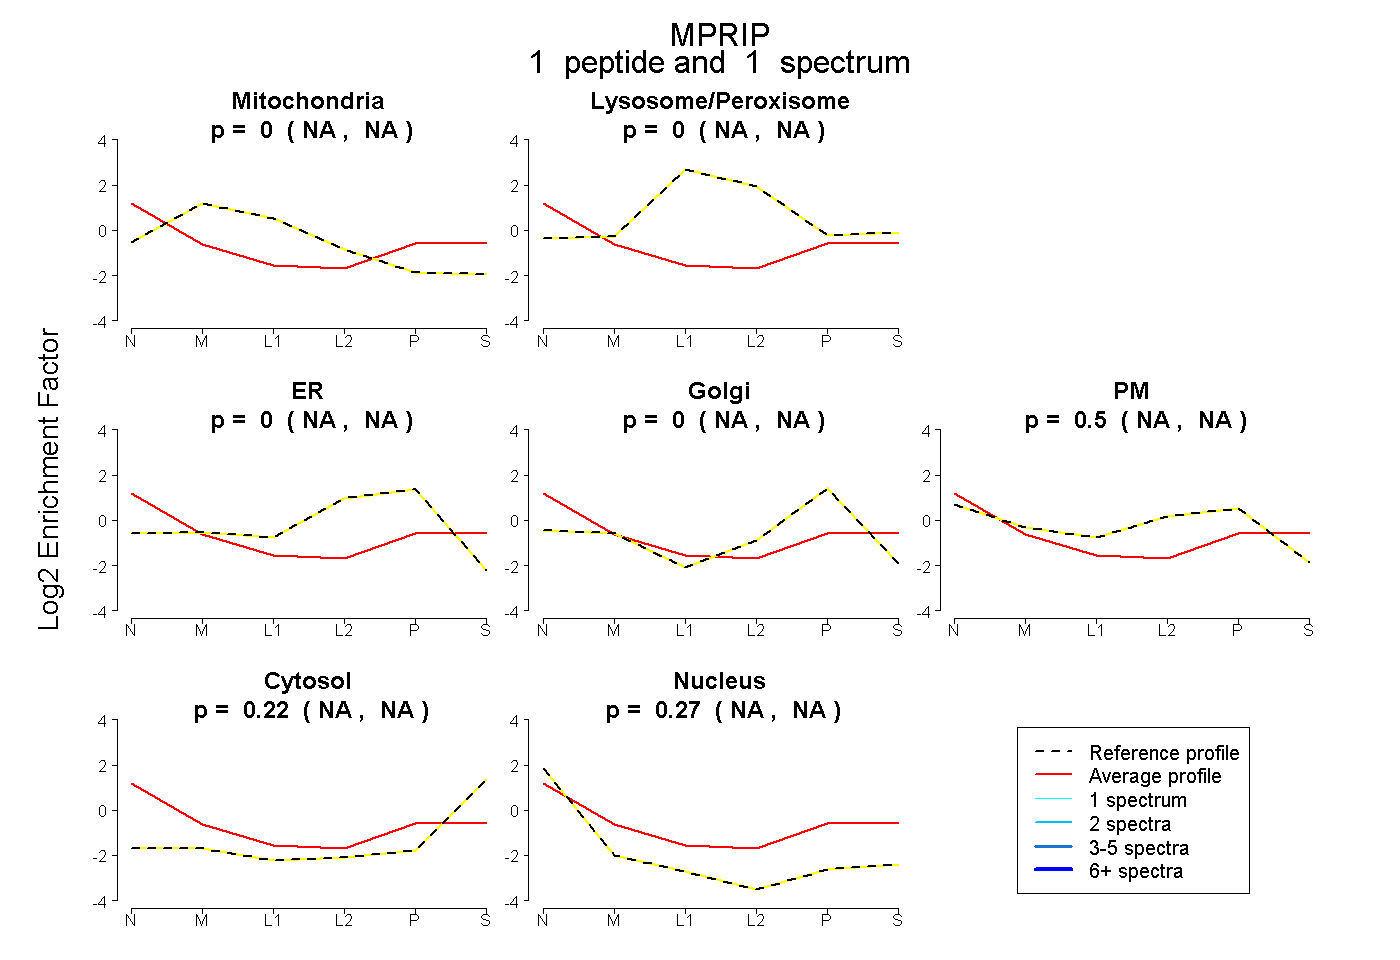 |
0.000 NA | NA |
0.000 NA | NA |
0.000 NA | NA |
0.000 NA | NA |
0.503 NA | NA |
0.223 NA | NA |
0.274 NA | NA |
|||
| Plot | Lyso | Other | |||||||||||
| Expt C |
3 peptides |
3 spectra |
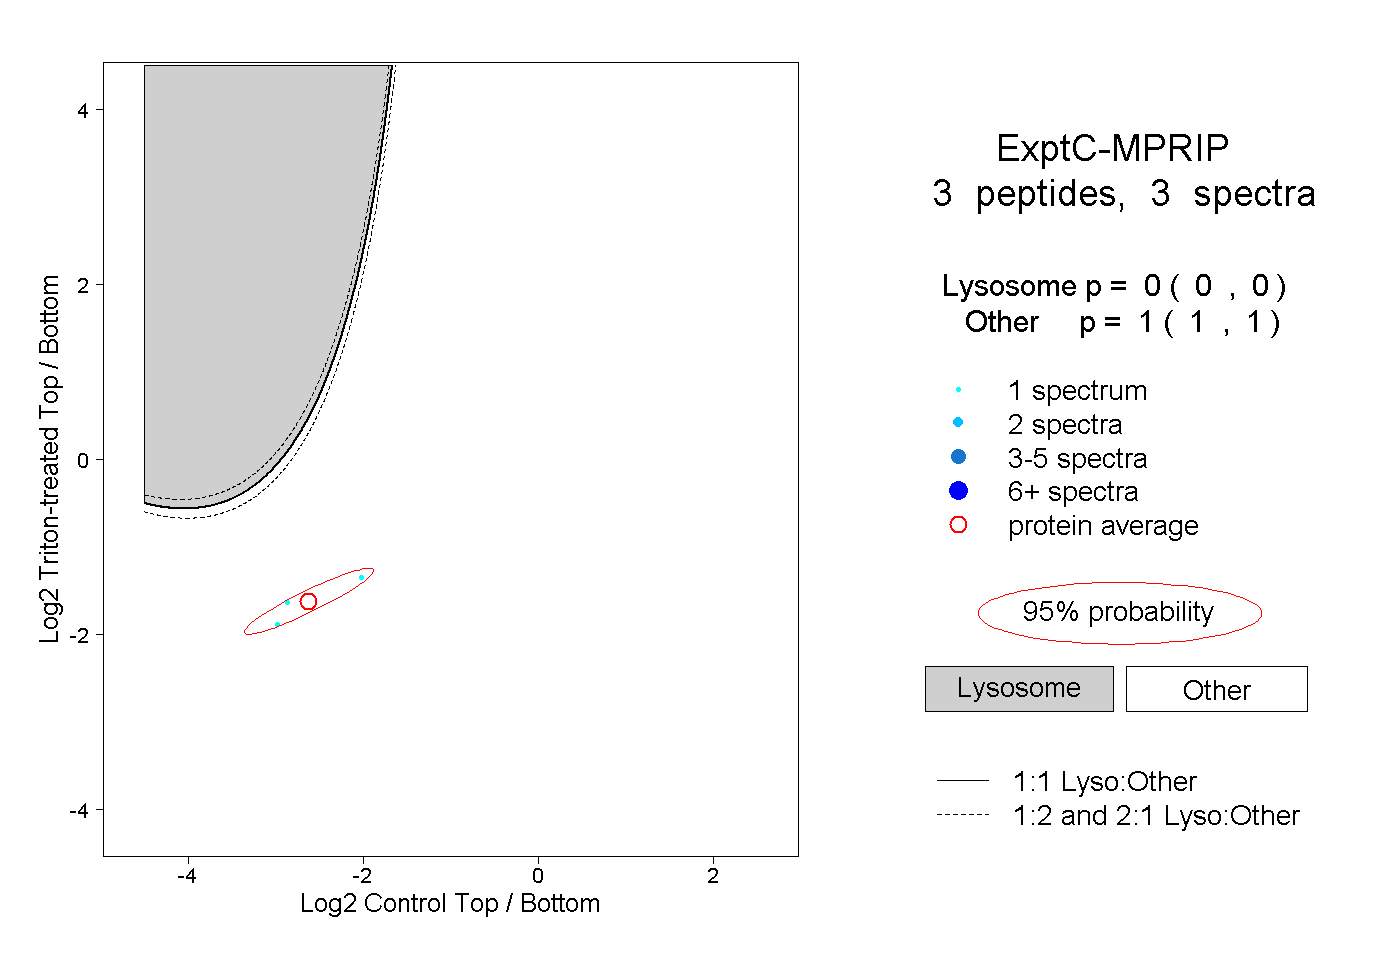 |
0.000 0.000 | 0.000 |
1.000 1.000 | 1.000 |