 5
5peptides
spectra
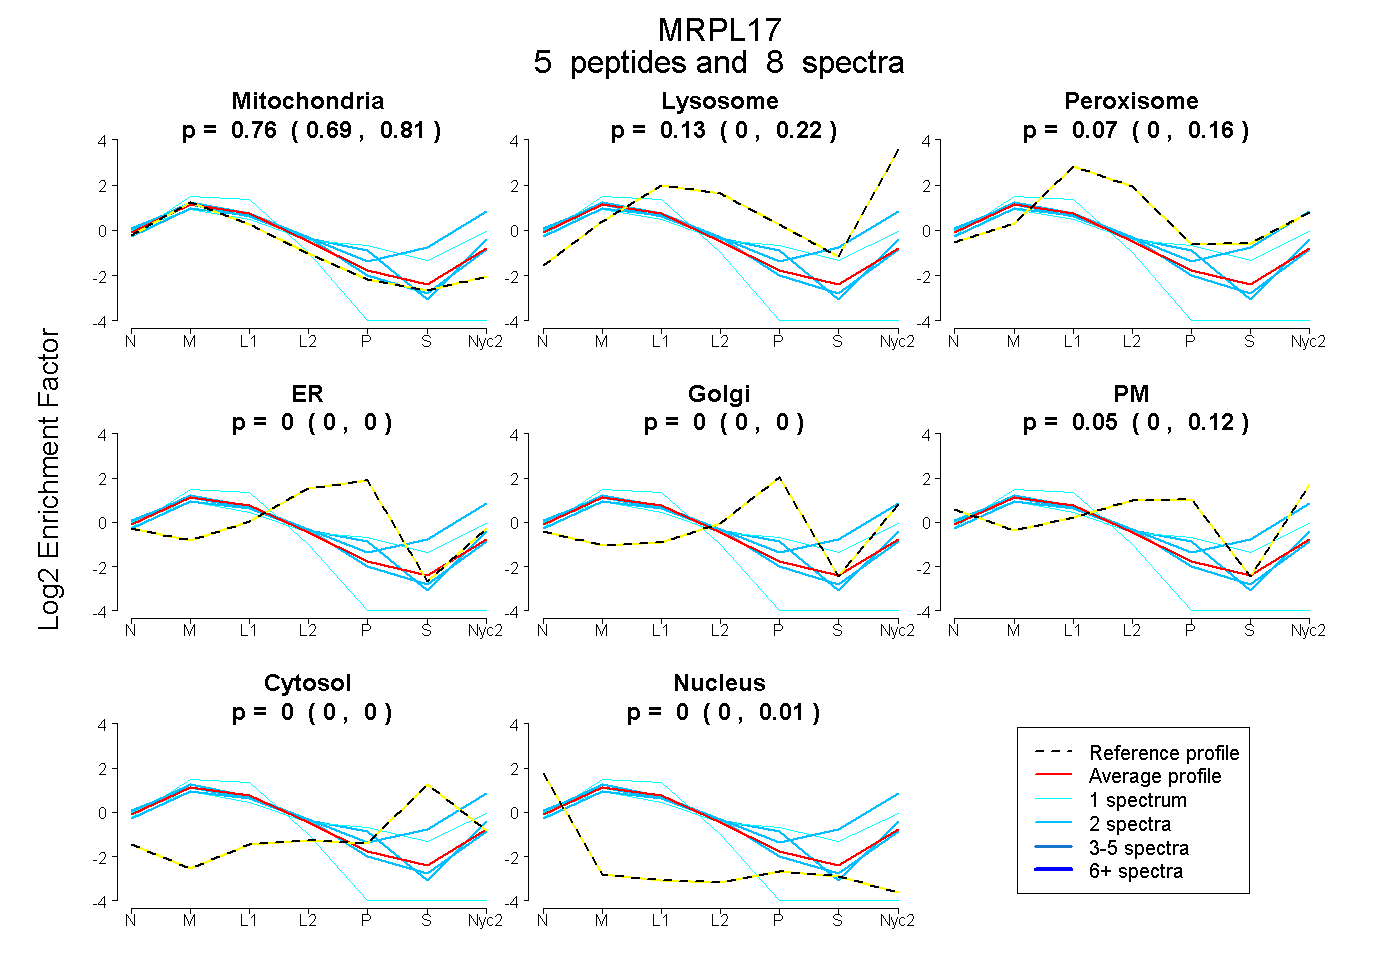
0.689 | 0.805
0.000 | 0.224
0.000 | 0.163
0.000 | 0.000
0.000 | 0.000
0.000 | 0.125
0.000 | 0.000
0.000 | 0.010
1peptide
spectra
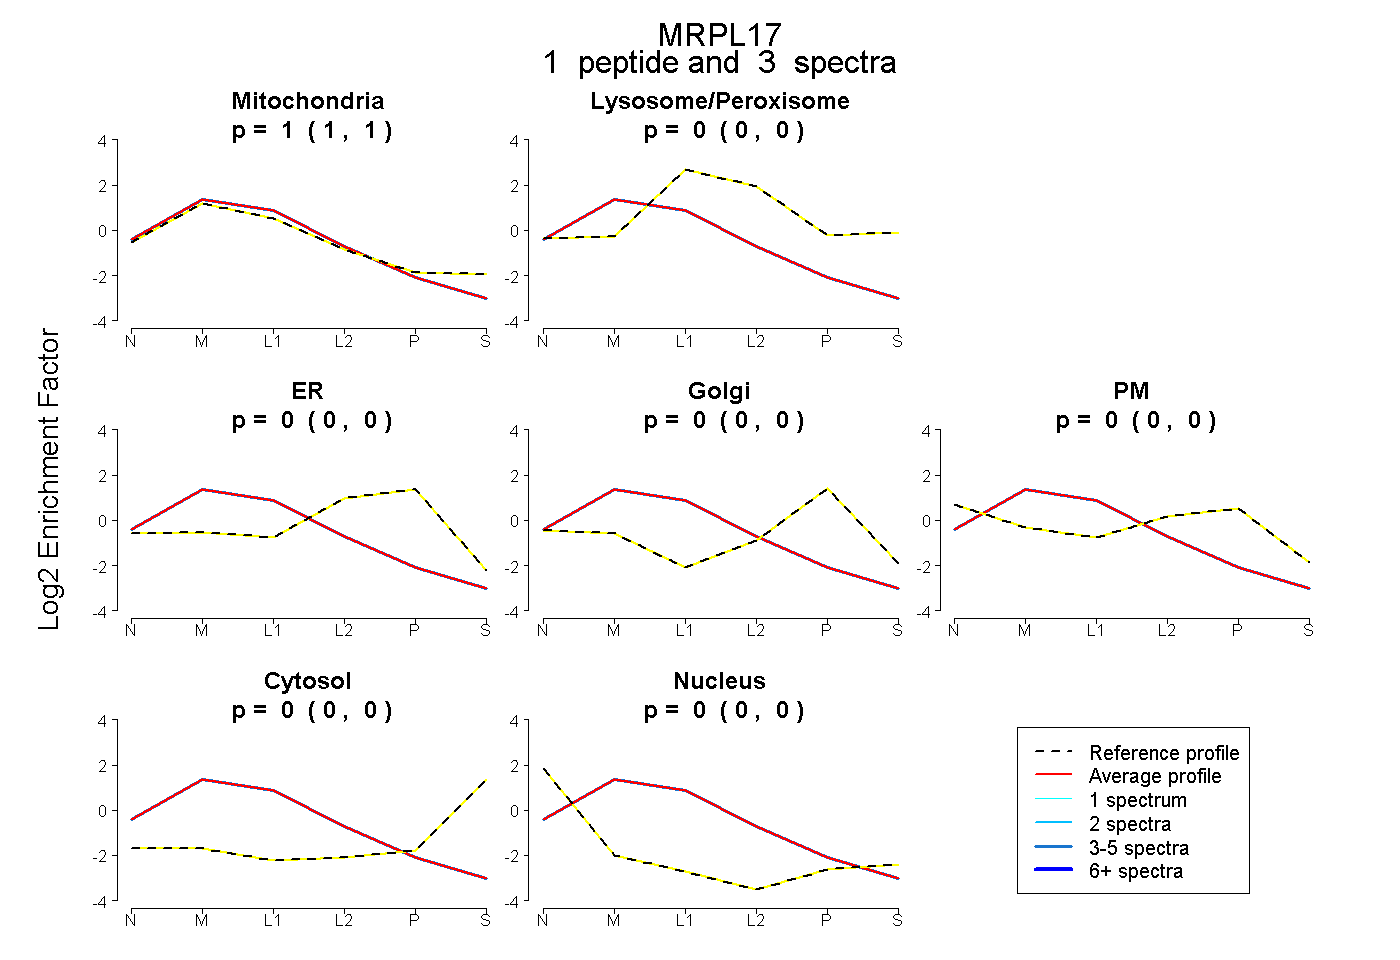
1.000 | 1.000
0.000 | 0.000
0.000 | 0.000
0.000 | 0.000
0.000 | 0.000
0.000 | 0.000
0.000 | 0.000
7peptides
spectra
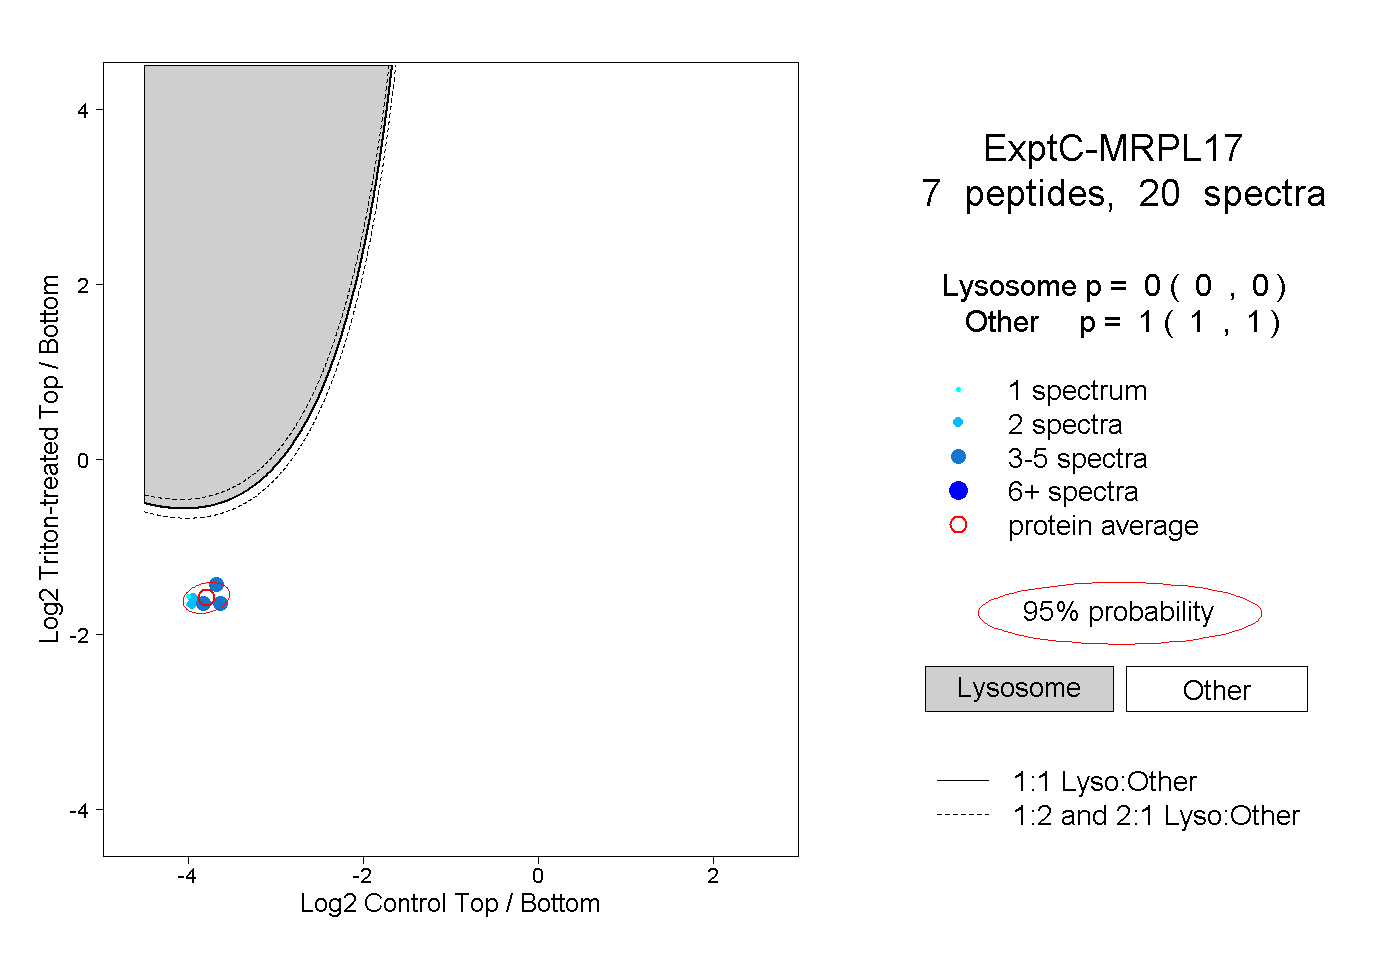
0.000 | 0.000
1.000 | 1.000
2peptides
spectra
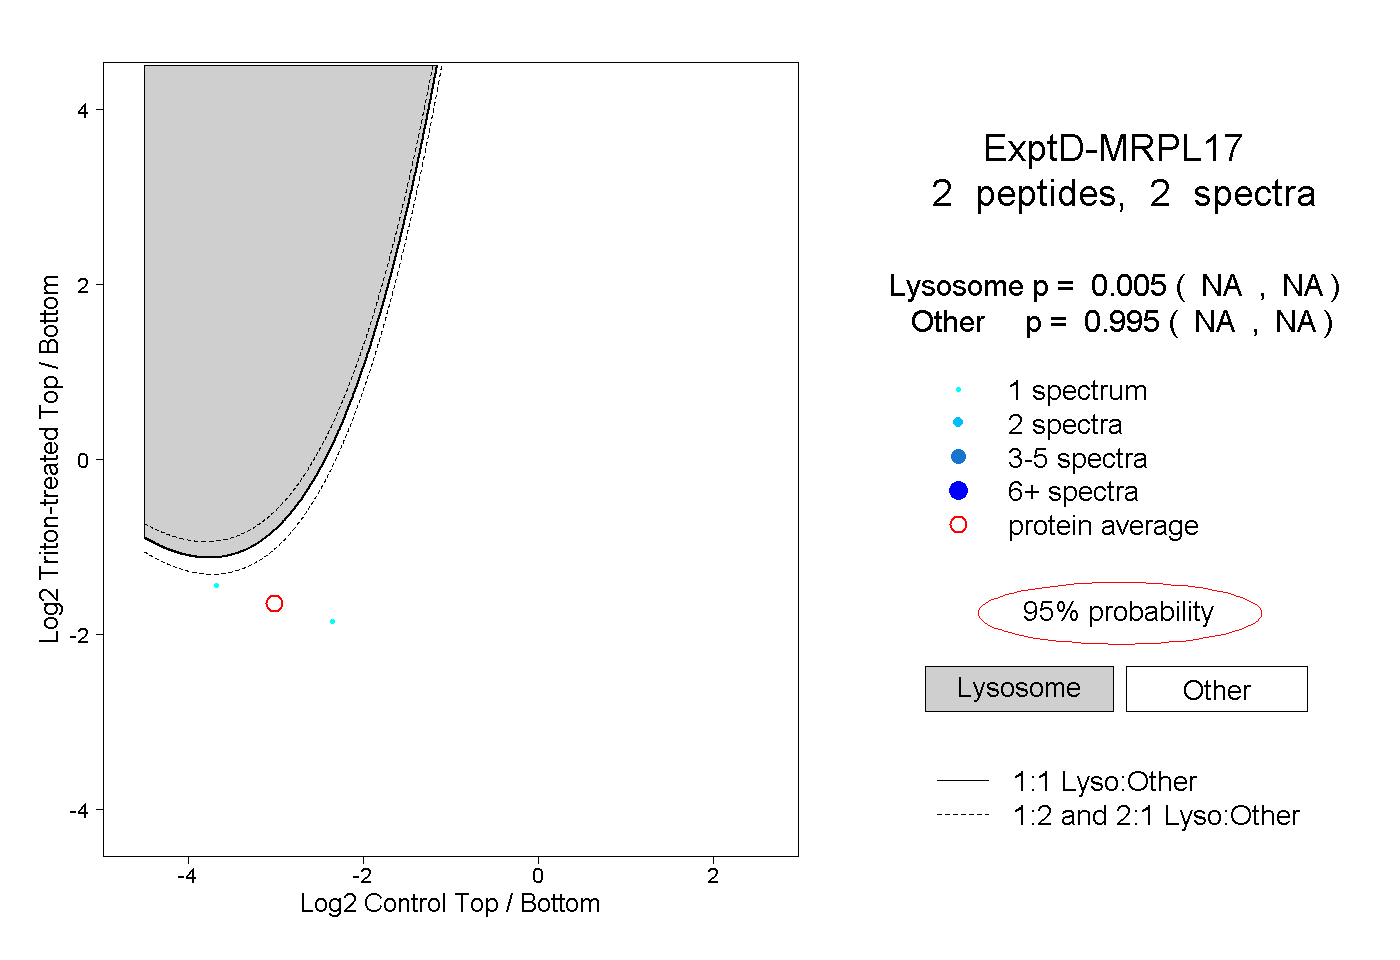
NA | NA
NA | NA