 5
5peptides
spectra
0.689 | 0.805
0.000 | 0.224
0.000 | 0.163
0.000 | 0.000
0.000 | 0.000
0.000 | 0.125
0.000 | 0.000
0.000 | 0.010
| Plot | Mito | Lyso | Perox | ER | Golgi | PM | Cytosol | Nucleus | |||||
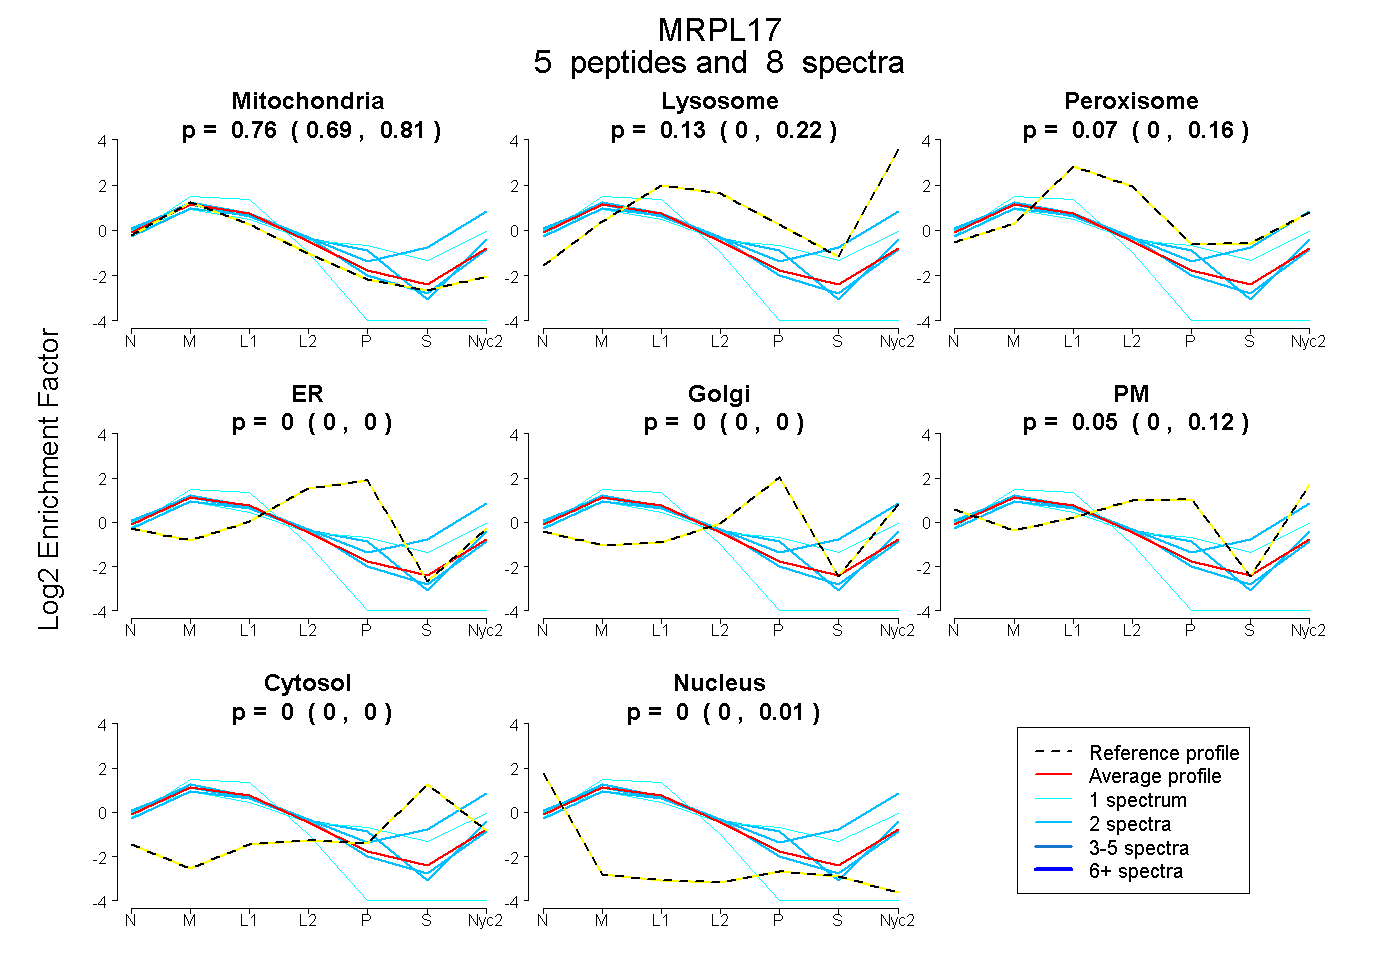
| Expt A |
5 peptides |
8 spectra |
|
0.761 0.689 | 0.805 |
0.125 0.000 | 0.224 |
0.065 0.000 | 0.163 |
0.000 0.000 | 0.000 |
0.000 0.000 | 0.000 |
0.049 0.000 | 0.125 |
0.000 0.000 | 0.000 |
0.000 0.000 | 0.010 |
| 1 spectrum, GNCLPPLPLPHR | 1.000 | 0.000 | 0.000 | 0.000 | 0.000 | 0.000 | 0.000 | 0.000 | ||
| 2 spectra, IEATWAR | 0.794 | 0.112 | 0.039 | 0.000 | 0.000 | 0.055 | 0.000 | 0.000 | ||
| 2 spectra, NLLTGLVR | 0.437 | 0.412 | 0.003 | 0.000 | 0.000 | 0.000 | 0.148 | 0.000 | ||
| 2 spectra, LGLGPESR | 0.627 | 0.043 | 0.000 | 0.000 | 0.000 | 0.330 | 0.000 | 0.000 | ||
| 1 spectrum, MADFWLTEK | 0.486 | 0.154 | 0.054 | 0.000 | 0.000 | 0.209 | 0.097 | 0.000 |
| Plot | Mito | Lyso or Perox | ER | Golgi | PM | Cytosol | Nucleus | ||||||
| Expt B |
1 peptide |
3 spectra |
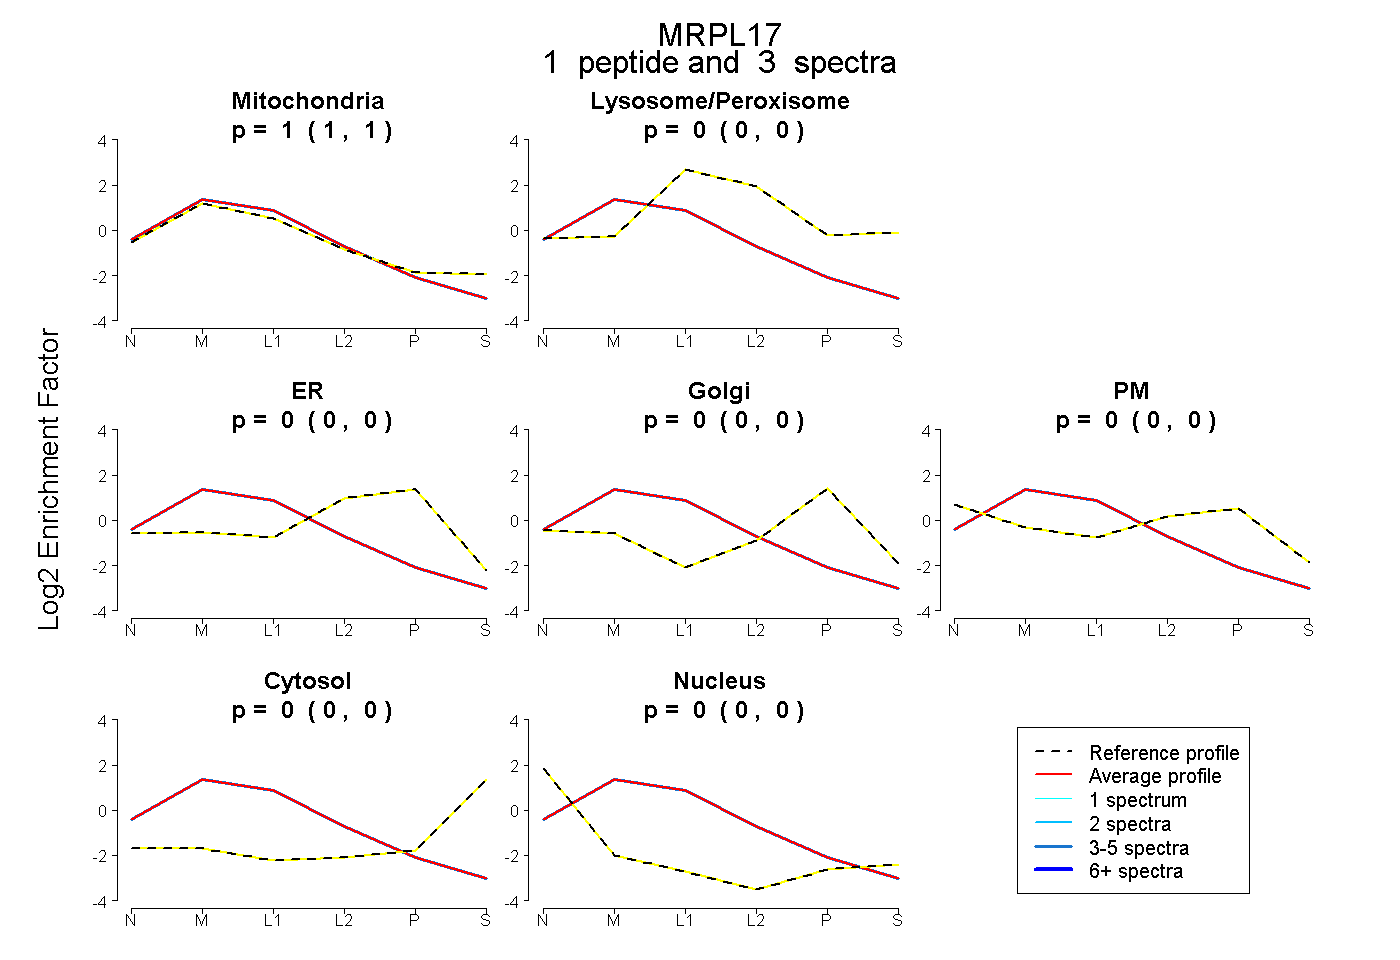 |
1.000 1.000 | 1.000 |
0.000 0.000 | 0.000 |
0.000 0.000 | 0.000 |
0.000 0.000 | 0.000 |
0.000 0.000 | 0.000 |
0.000 0.000 | 0.000 |
0.000 0.000 | 0.000 |
|||
| Plot | Lyso | Other | |||||||||||
| Expt C |
7 peptides |
20 spectra |
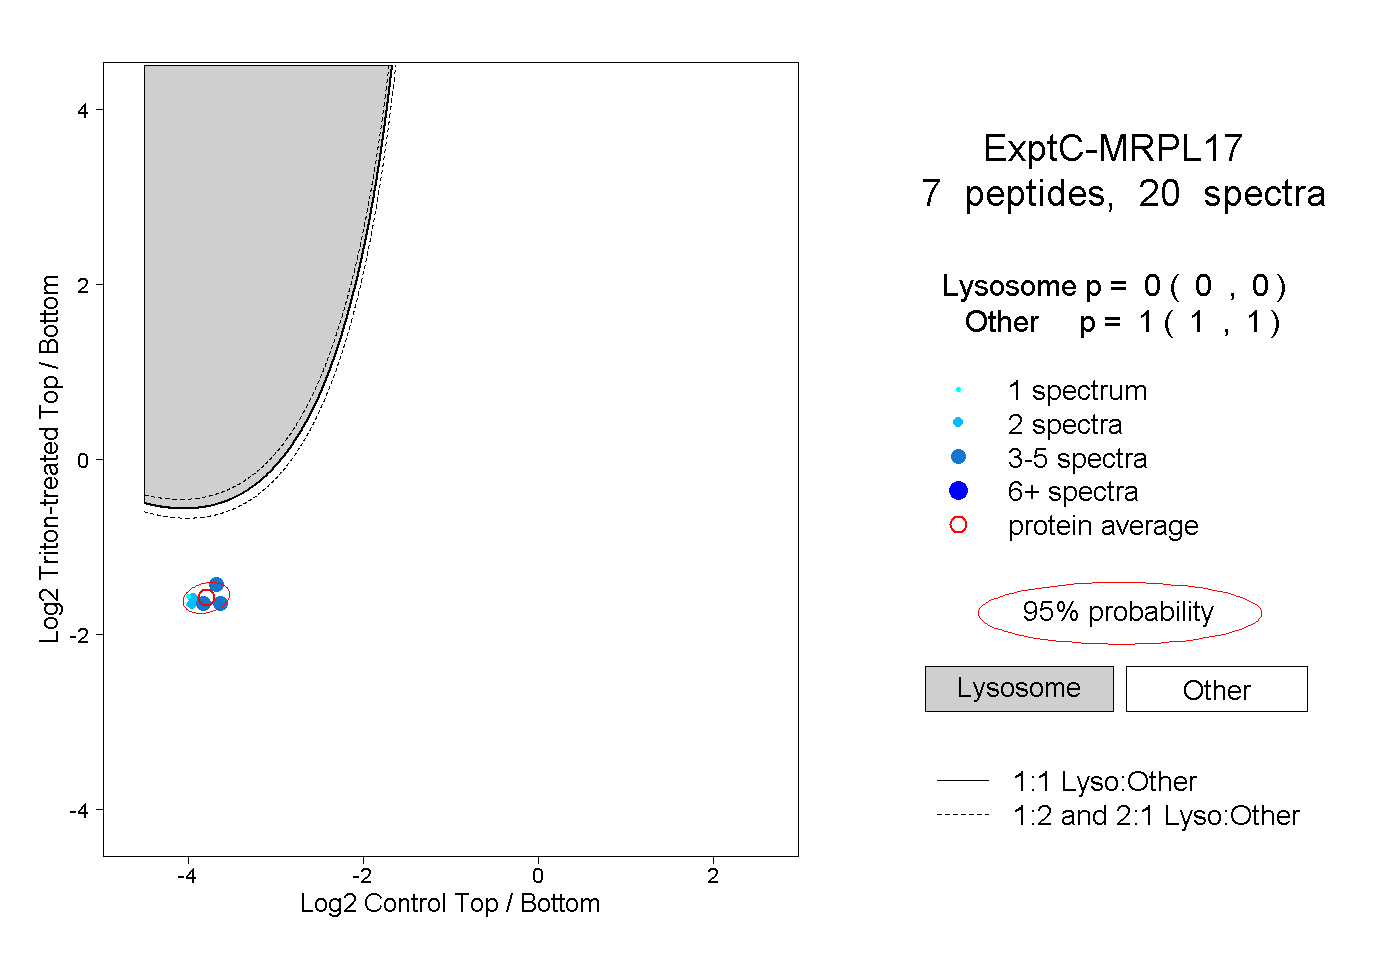 |
0.000 0.000 | 0.000 |
1.000 1.000 | 1.000 |
||||||||
| Plot | Lyso | Other | |||||||||||
| Expt D |
2 peptides |
2 spectra |
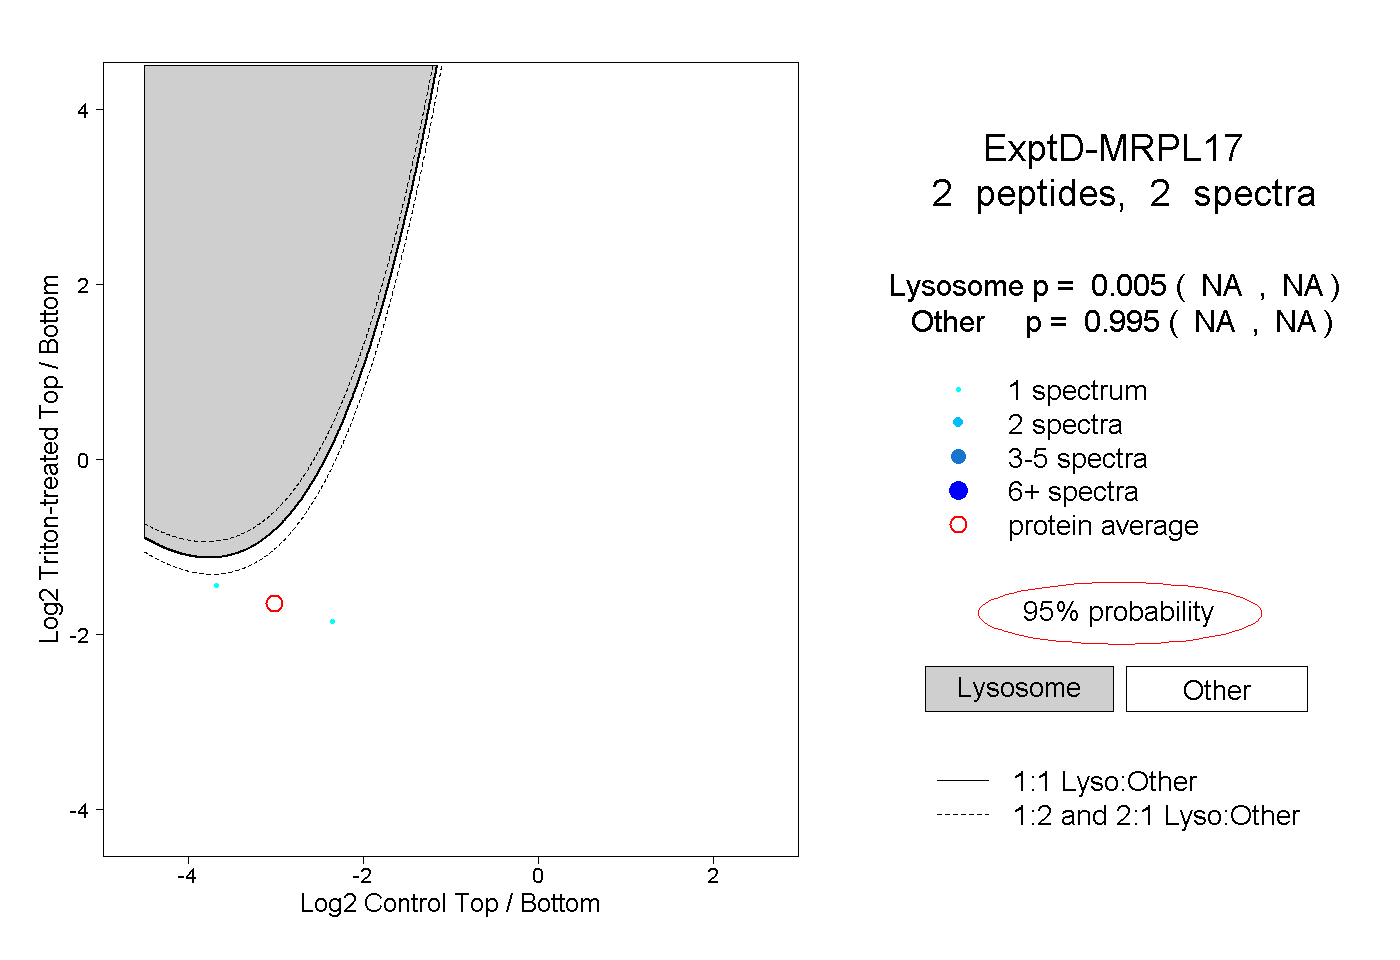 |
0.005 NA | NA |
0.995 NA | NA |