 10
10peptides
spectra
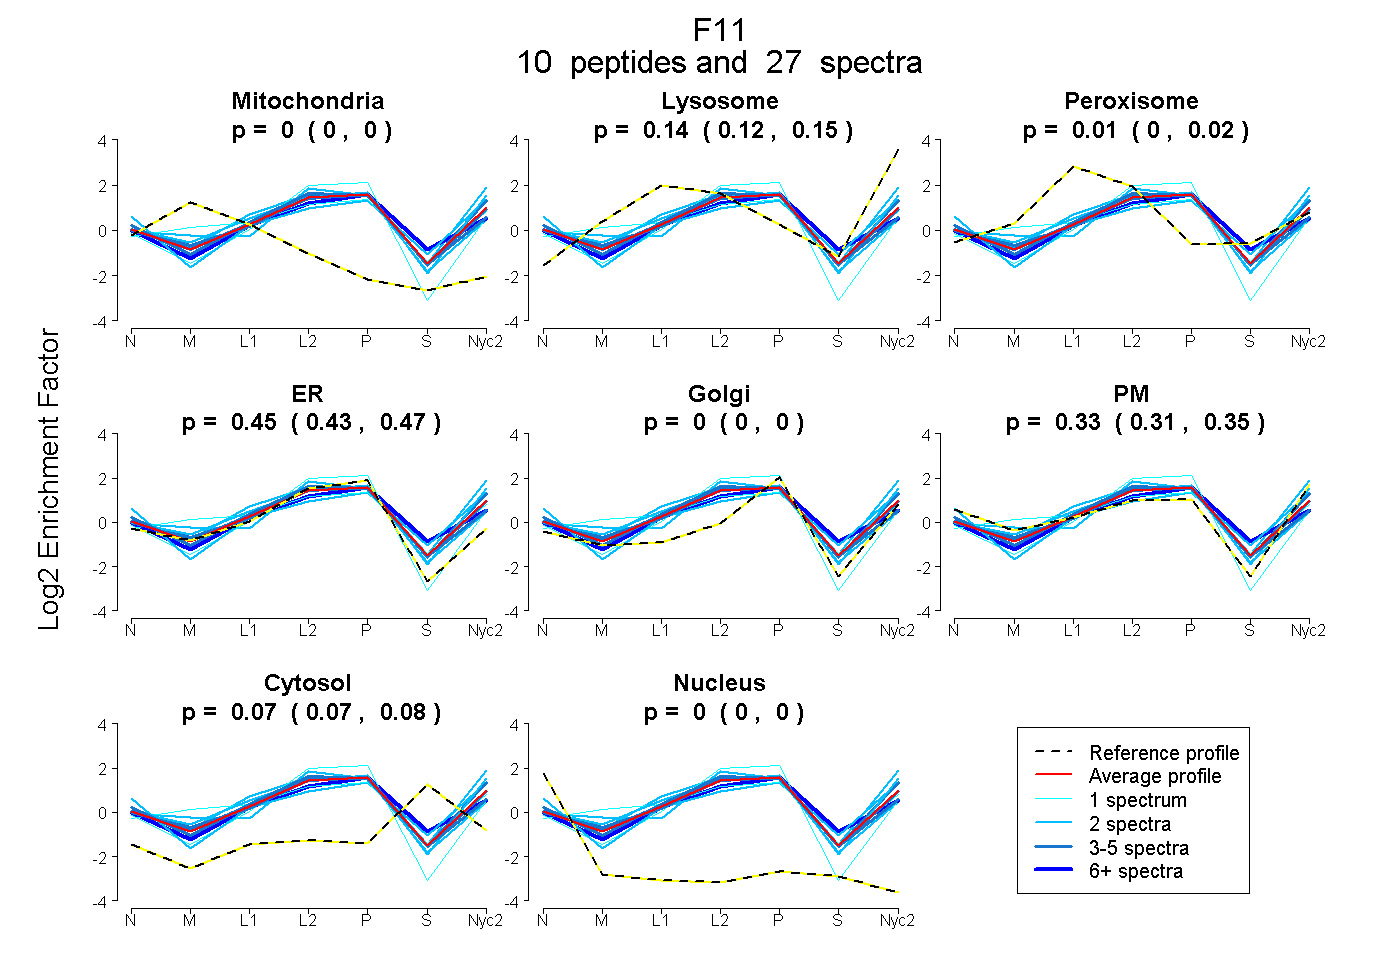
0.000 | 0.000
0.122 | 0.148
0.000 | 0.019
0.432 | 0.466
0.000 | 0.000
0.311 | 0.349
0.066 | 0.081
0.000 | 0.000
4peptides
spectra
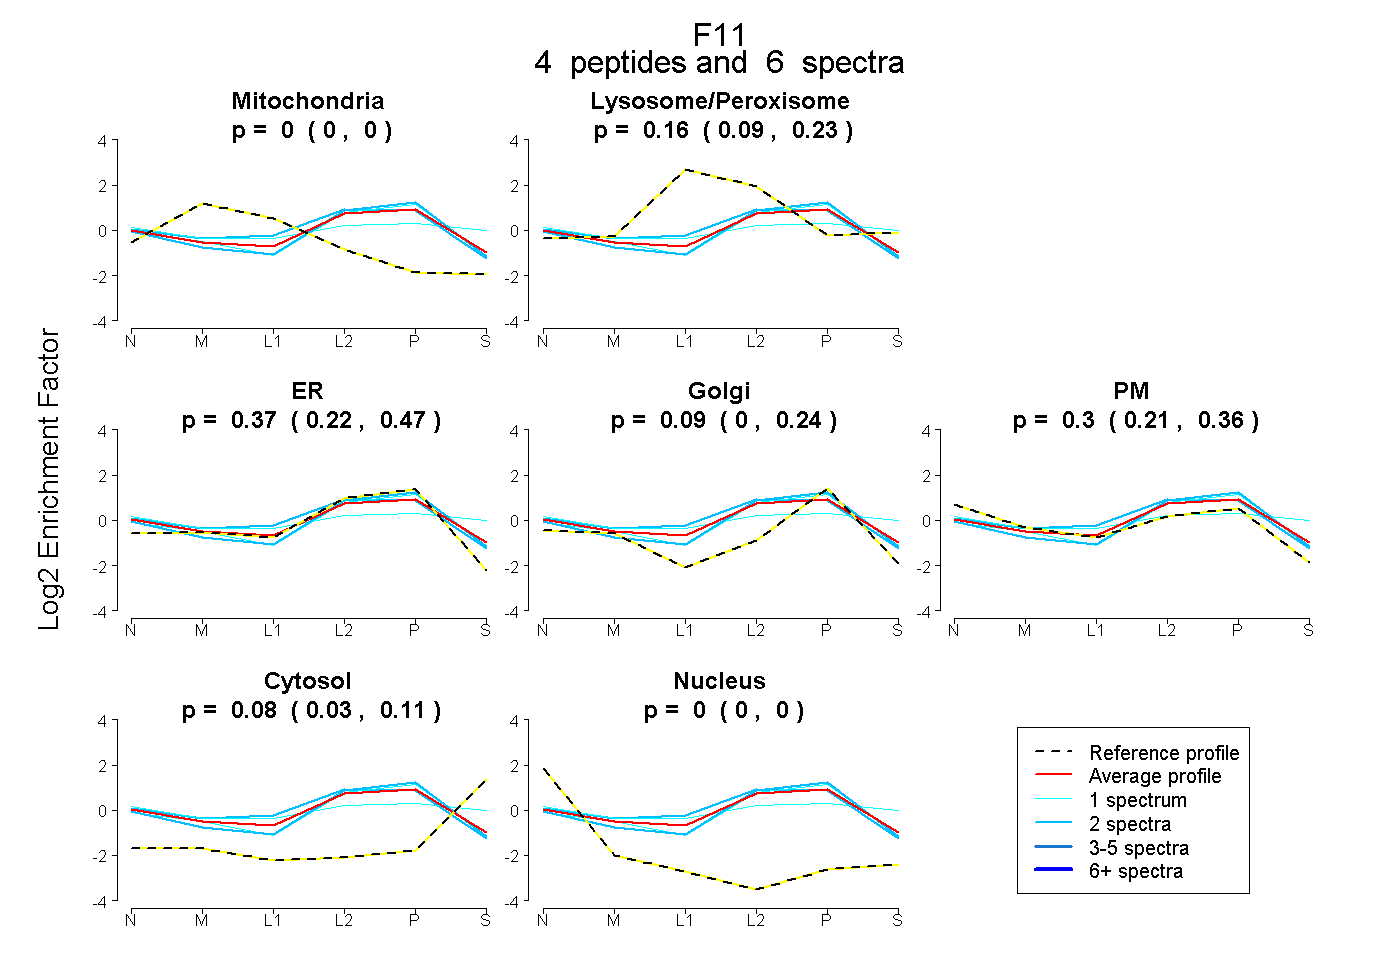
0.000 | 0.000
0.092 | 0.232
0.224 | 0.466
0.000 | 0.238
0.213 | 0.365
0.030 | 0.111
0.000 | 0.000
8peptides
spectra
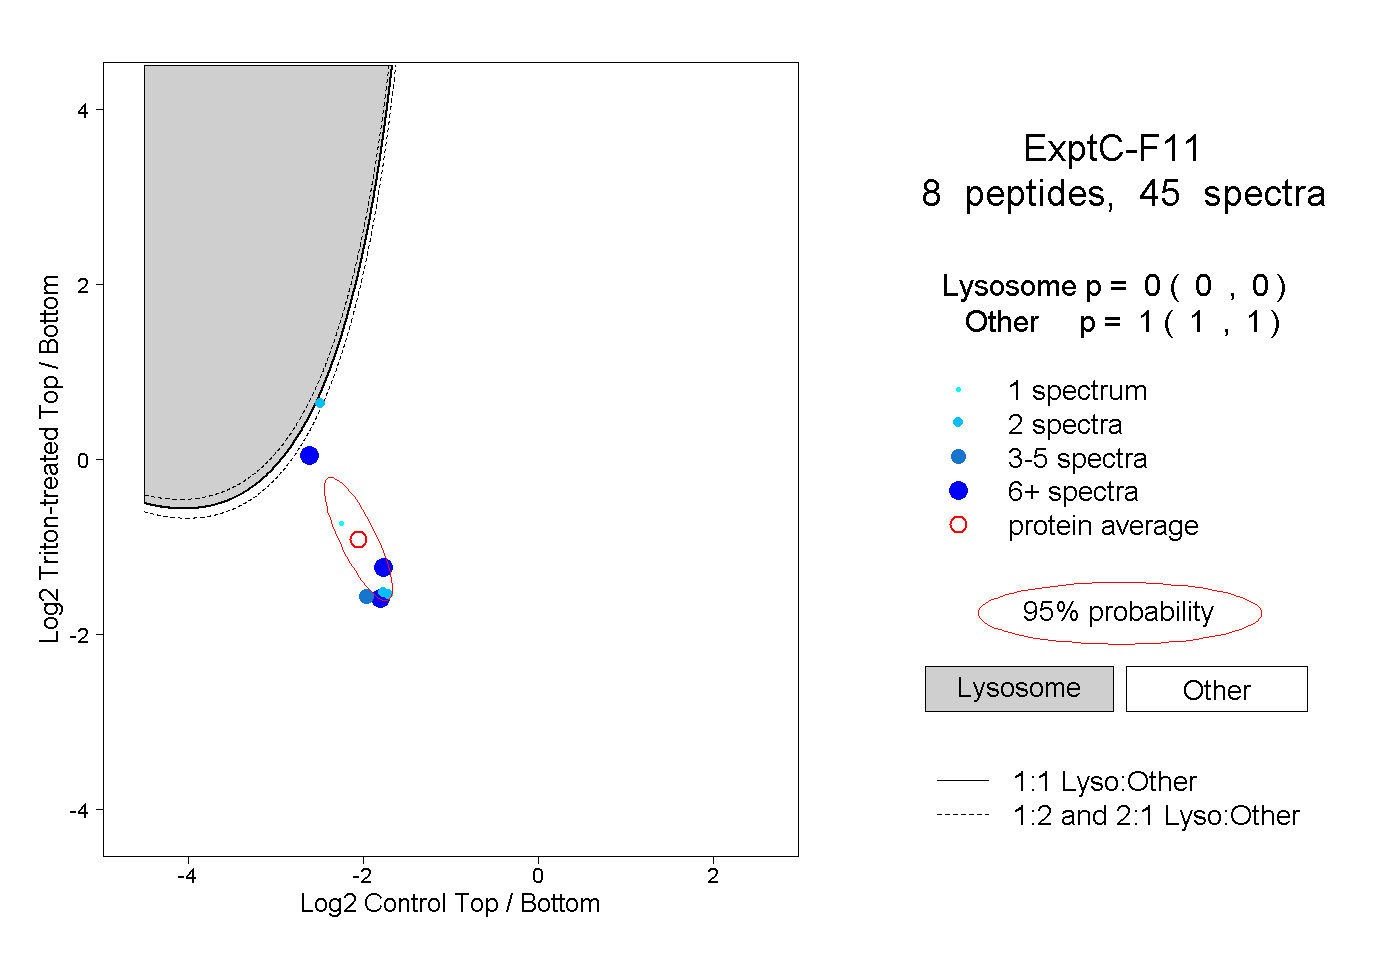
0.000 | 0.000
1.000 | 1.000
5peptides
spectra
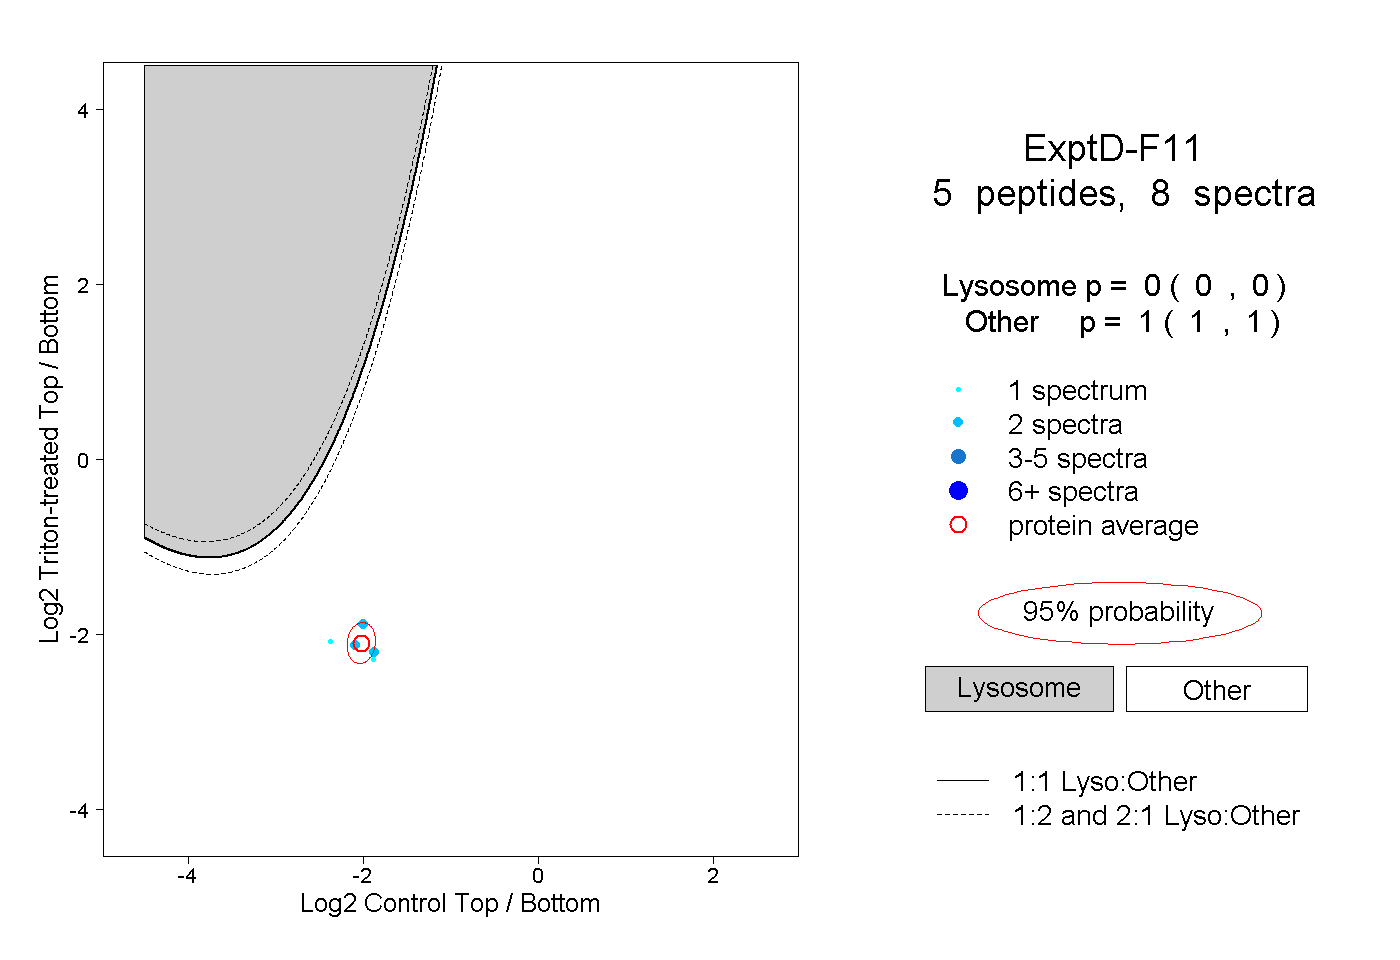
0.000 | 0.000
1.000 | 1.000