 10
10peptides
spectra
0.000 | 0.000
0.122 | 0.148
0.000 | 0.019
0.432 | 0.466
0.000 | 0.000
0.311 | 0.349
0.066 | 0.081
0.000 | 0.000
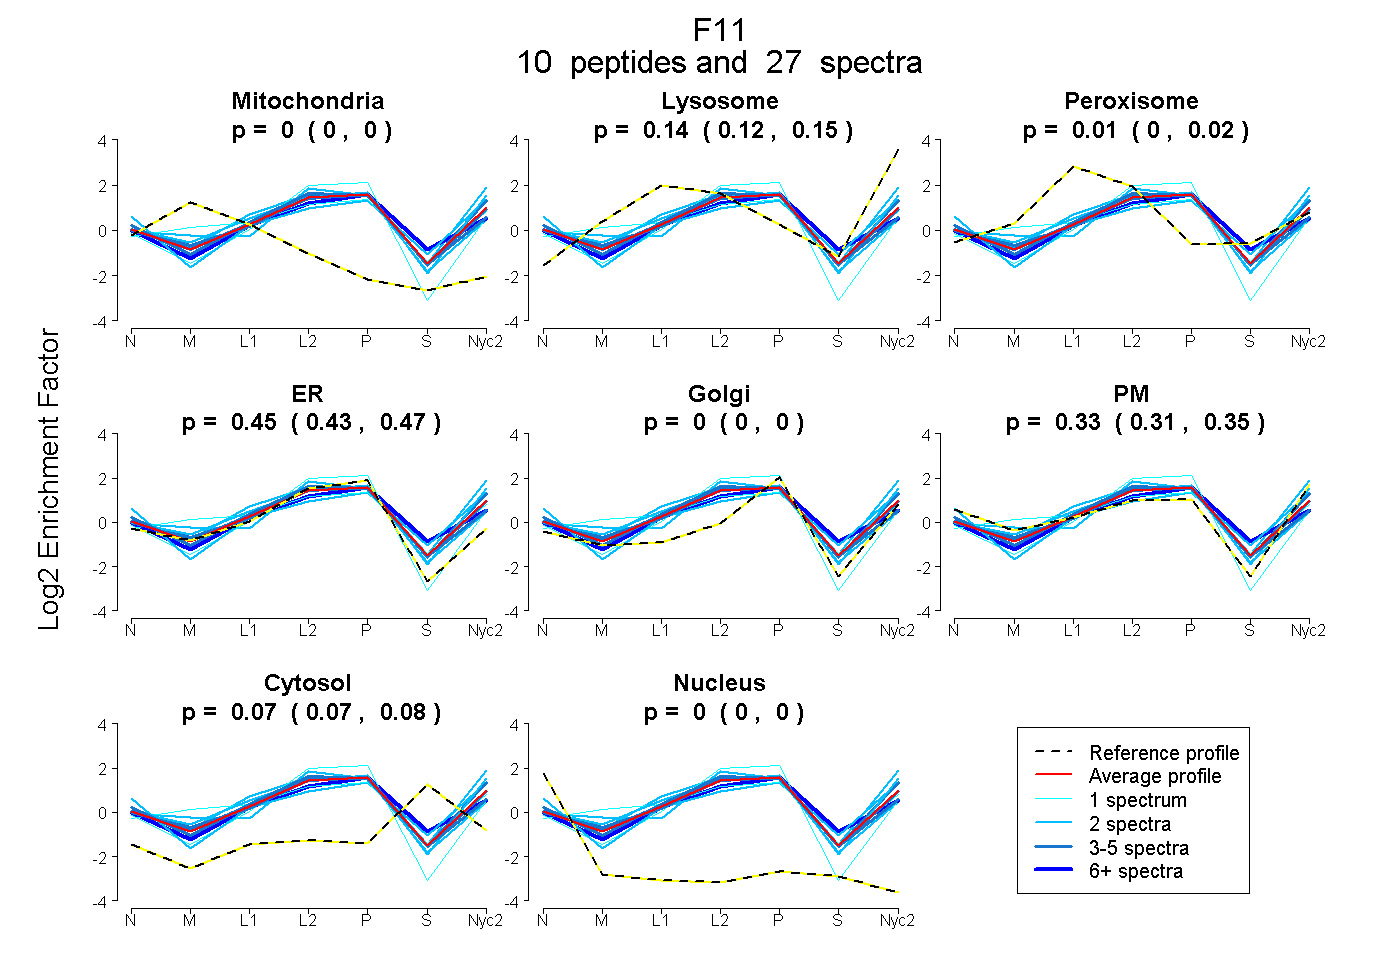
| Plot | Mito | Lyso | Perox | ER | Golgi | PM | Cytosol | Nucleus | |||||
| Expt A |
10 peptides |
27 spectra |
|
0.000 0.000 | 0.000 |
0.137 0.122 | 0.148 |
0.007 0.000 | 0.019 |
0.451 0.432 | 0.466 |
0.000 0.000 | 0.000 |
0.331 0.311 | 0.349 |
0.074 0.066 | 0.081 |
0.000 0.000 | 0.000 |
| 2 spectra, ERPGVYTNVAK | 0.000 | 0.070 | 0.023 | 0.643 | 0.000 | 0.233 | 0.030 | 0.000 | ||
| 1 spectrum, QCPQQLSACSK | 0.000 | 0.076 | 0.279 | 0.199 | 0.370 | 0.077 | 0.000 | 0.000 | ||
| 1 spectrum, HLCLLK | 0.000 | 0.000 | 0.000 | 0.840 | 0.000 | 0.160 | 0.000 | 0.000 | ||
| 3 spectra, VPLVSNEECQTR | 0.000 | 0.000 | 0.121 | 0.518 | 0.000 | 0.298 | 0.064 | 0.000 | ||
| 8 spectra, GDSGGPLSCK | 0.000 | 0.075 | 0.052 | 0.486 | 0.000 | 0.206 | 0.181 | 0.000 | ||
| 2 spectra, CQFFTYYPSR | 0.000 | 0.307 | 0.000 | 0.272 | 0.019 | 0.386 | 0.016 | 0.000 | ||
| 3 spectra, YVDWILEK | 0.000 | 0.131 | 0.019 | 0.470 | 0.000 | 0.309 | 0.071 | 0.000 | ||
| 3 spectra, TSESGFPSTR | 0.000 | 0.176 | 0.000 | 0.367 | 0.050 | 0.368 | 0.039 | 0.000 | ||
| 2 spectra, MCSDNVR | 0.000 | 0.000 | 0.008 | 0.070 | 0.000 | 0.739 | 0.183 | 0.000 | ||
| 2 spectra, VICAGYK | 0.000 | 0.207 | 0.000 | 0.334 | 0.041 | 0.419 | 0.000 | 0.000 |
| Plot | Mito | Lyso or Perox | ER | Golgi | PM | Cytosol | Nucleus | ||||||
| Expt B |
4 peptides |
6 spectra |
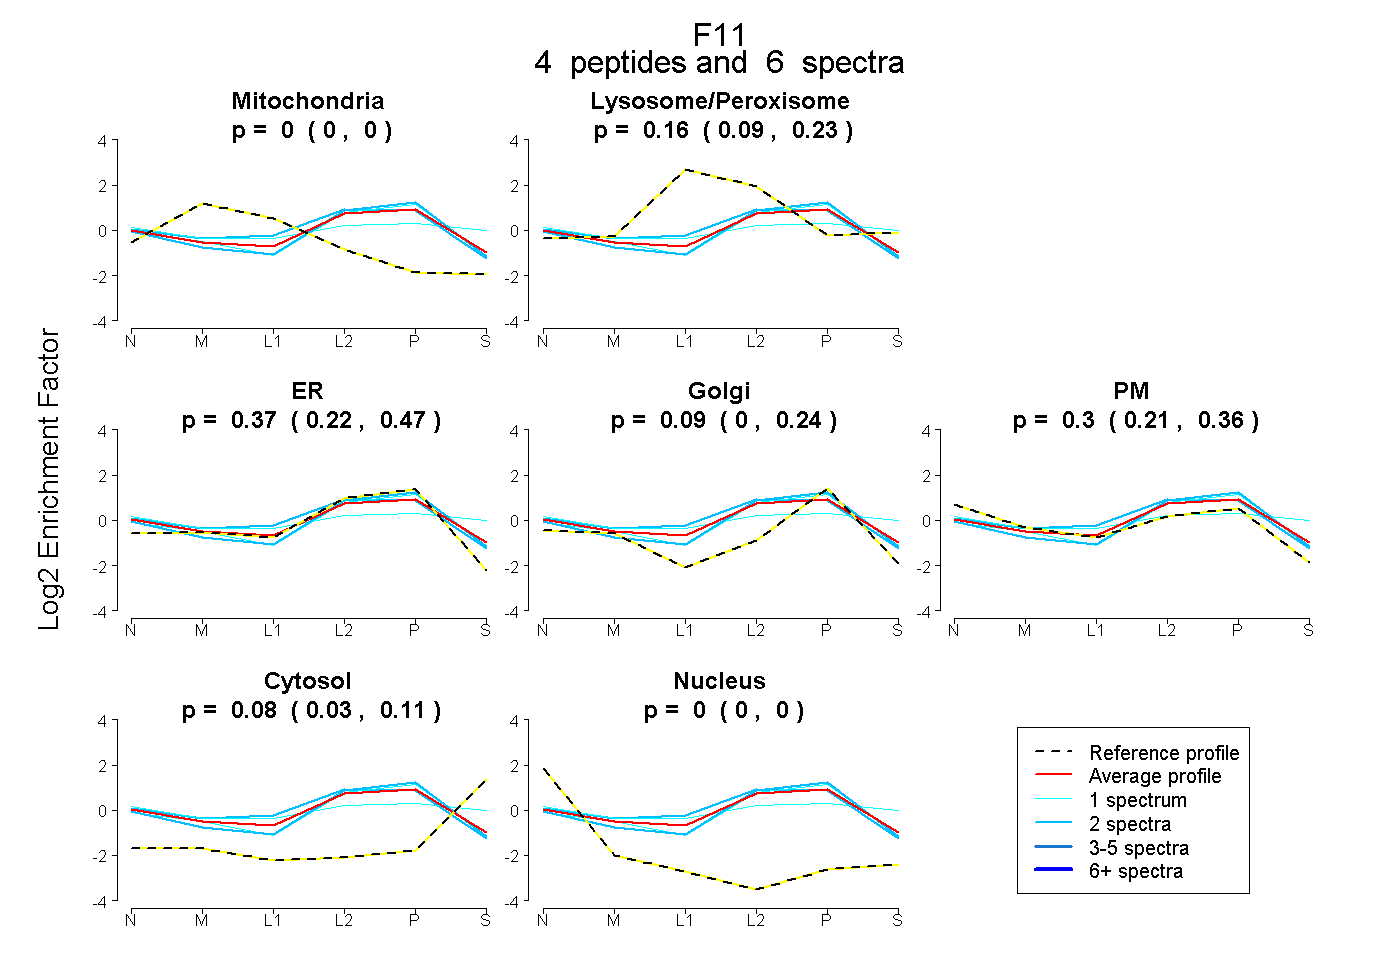 |
0.000 0.000 | 0.000 |
0.160 0.092 | 0.232 |
0.372 0.224 | 0.466 |
0.091 0.000 | 0.238 |
0.301 0.213 | 0.365 |
0.076 0.030 | 0.111 |
0.000 0.000 | 0.000 |
|||
| Plot | Lyso | Other | |||||||||||
| Expt C |
8 peptides |
45 spectra |
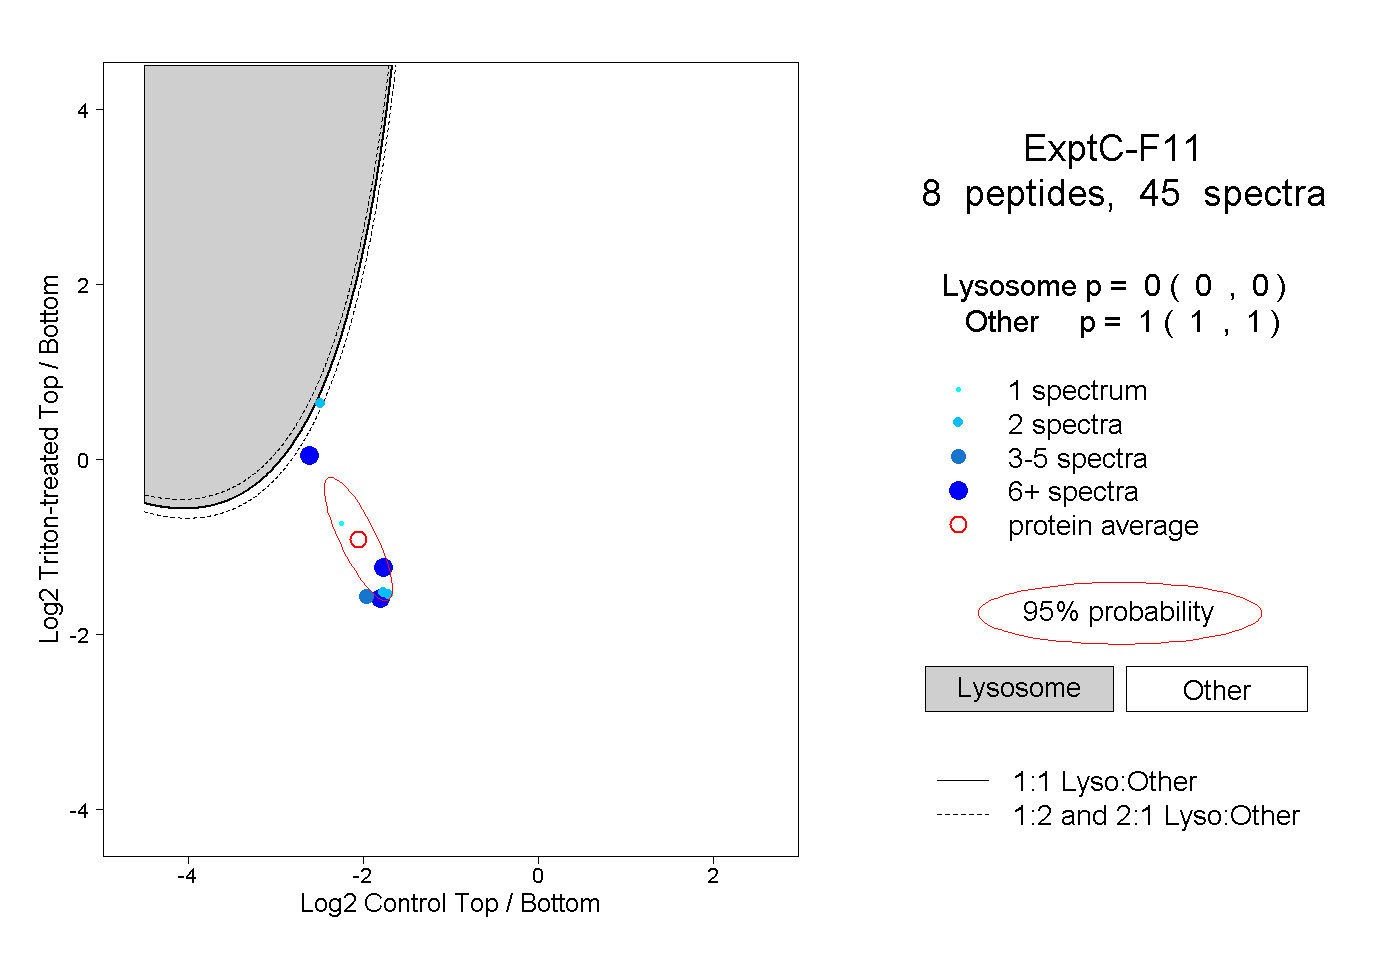 |
0.000 0.000 | 0.000 |
1.000 1.000 | 1.000 |
||||||||
| Plot | Lyso | Other | |||||||||||
| Expt D |
5 peptides |
8 spectra |
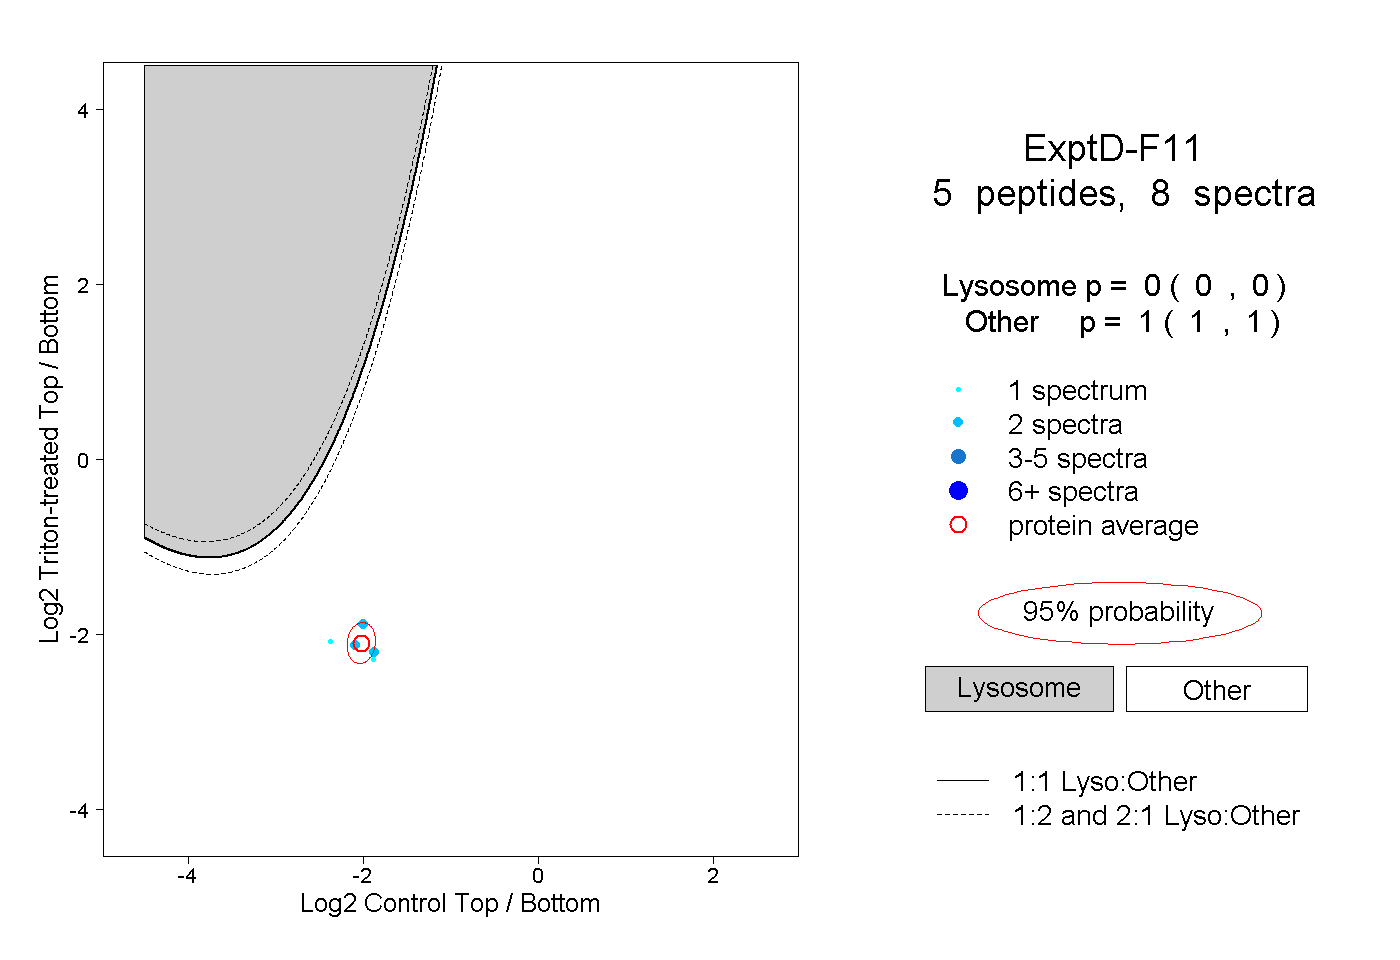 |
0.000 0.000 | 0.000 |
1.000 1.000 | 1.000 |